Splunk
Introduction
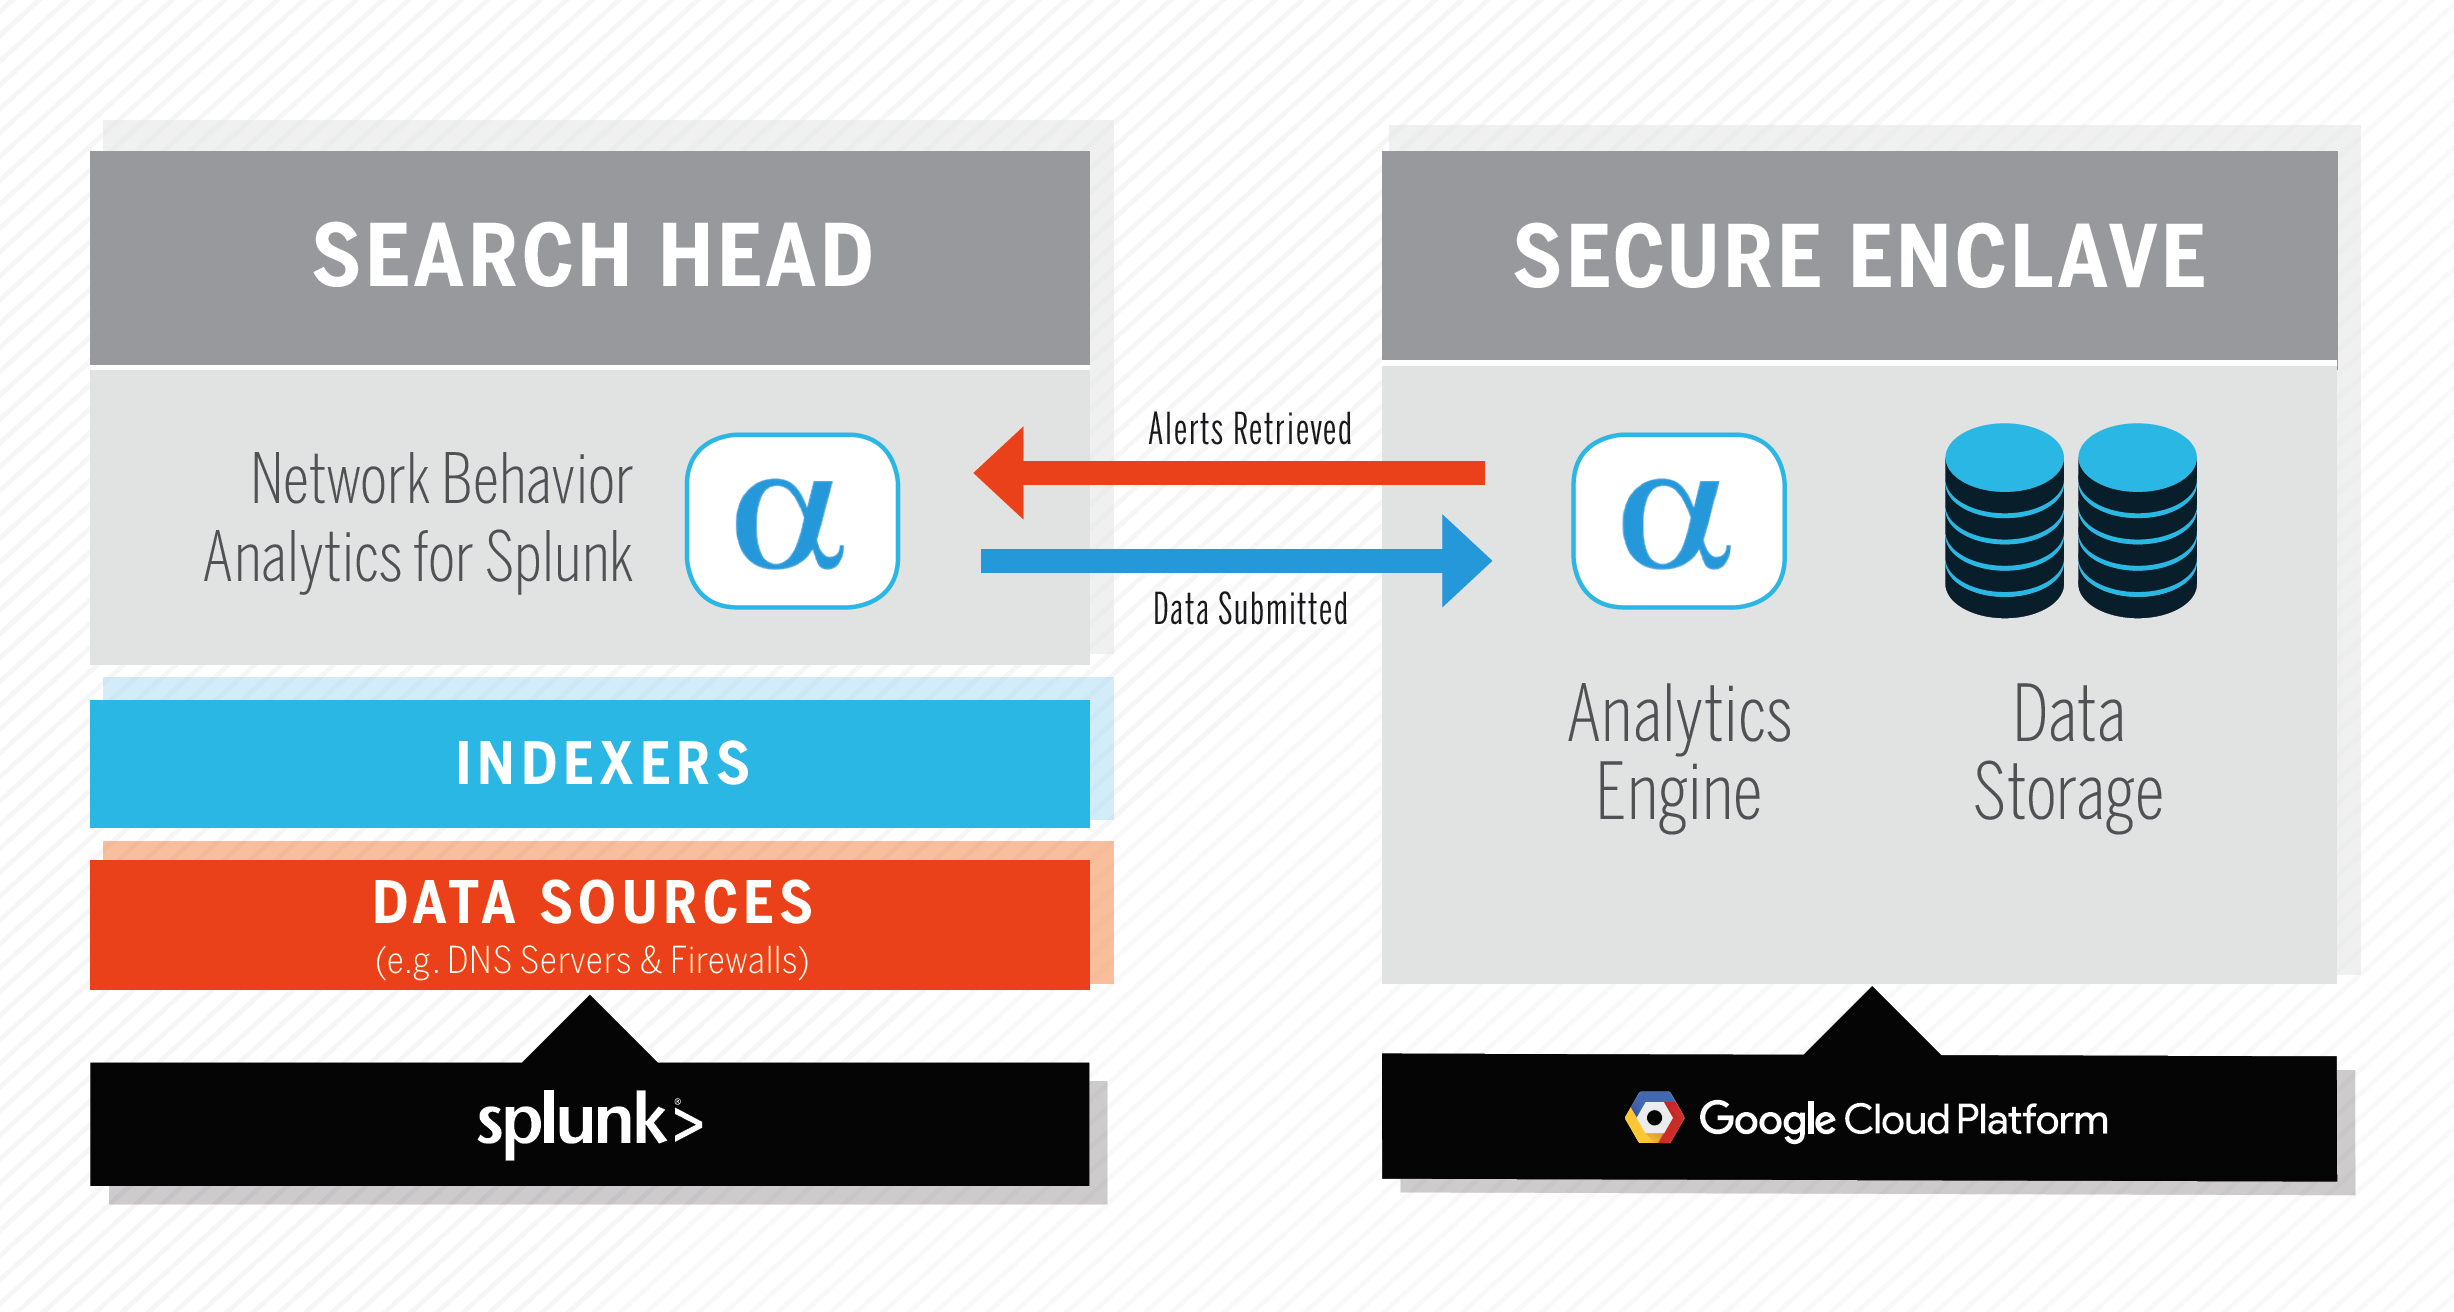
Use Network Behavior Analytics for Splunk to quickly uncover infected hosts and threats to your environment. The Splunk app processes and submits network telemetry (CIM-compliant DNS, IP, HTTP, and TLS events) to the AlphaSOC Analytics Engine for scoring, and retrieves security alerts and data for investigation. The system architecture is shown below, and the Analytics Engine can be provided as a package for on-premise deployment.
Product Installation
Pre-Installation Checklist
Before installing Network Behavior Analytics for Splunk, please ensure:
- You are indexing egress network events within your Splunk environment
- Your Search Head can access api.alphasoc.net via HTTPS (TCP port 443)
- You have administrative privileges within Splunk (our app requires particular permissions)
DNS resolution events may be obtained from your name servers, full-packet capture (e.g. Zeek or Suricata), or infrastructure processing outbound HTTP requests (e.g. Blue Coat ProxySG or Zscaler). IP events are commonly logged by firewalls, but may be obtained from IDS logs, Splunk Stream, or other sources.
Installing Network Behavior Analytics for Splunk
Install the application within Splunk by browsing to Apps > Manage Apps > Find more apps online, and searching for Network Behavior Analytics, or downloading the package from Splunkbase and uploading to your Search Head. Follow the on-screen installation steps and restart Splunk.
API Key Generation
The first time that you run Network Behavior Analytics for Splunk, the app will contact our licensing server to provision an API key. Upon generating a key, verify your email address to view alerts and use the dashboards. An activated API key is unrestricted for 30 days for evaluation purposes.
Adhere to the terms of service and generate an API key as follows:
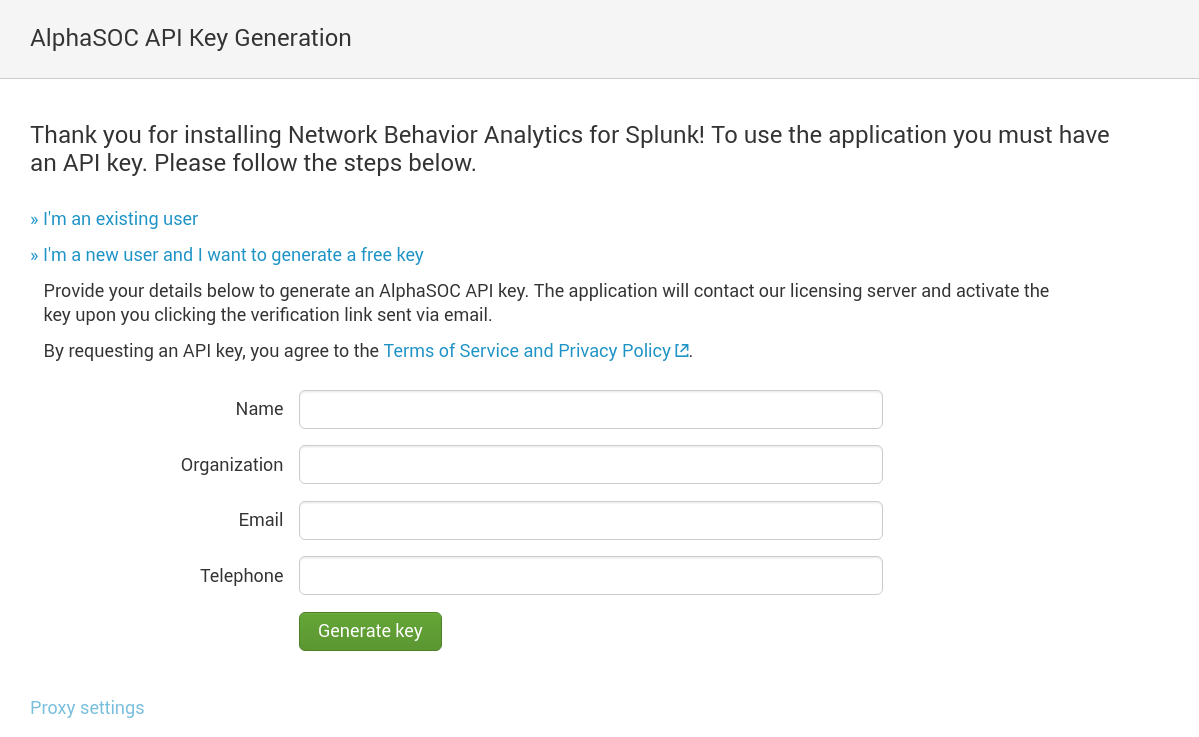
If you are an existing AlphaSOC customer, select I'm an existing user to reset or provide your AlphaSOC API key to complete installation. Please contact support@alphasoc.com if you run into any difficulties.
Configuring Data Providers
Once installed, click into the Data Location tab within the app to configure data providers.
If you already use a CIM compliant add-on to index your DNS, IP, and HTTP network events, the app will automatically load the events and further configuration is not required. If you are not using a CIM compliant add-on already, one must be configured to load data for scoring.
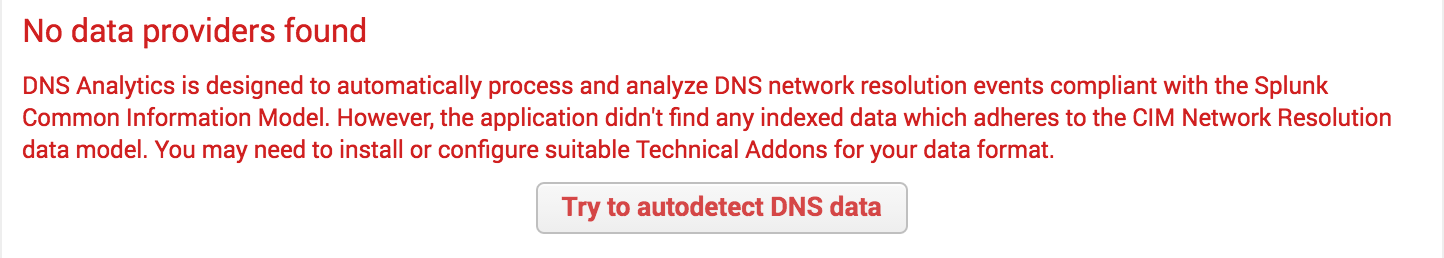
On the left side of the screen, you will see tabs for the different telemetry types that the Splunk app can process (e.g. DNS, IP, HTTP, TLS). As you click into each, the app will display the data provider health and number of events. The autodetect feature will provide you with next steps if no data is found:
If things are configured correctly, the app will show that it is collecting events:
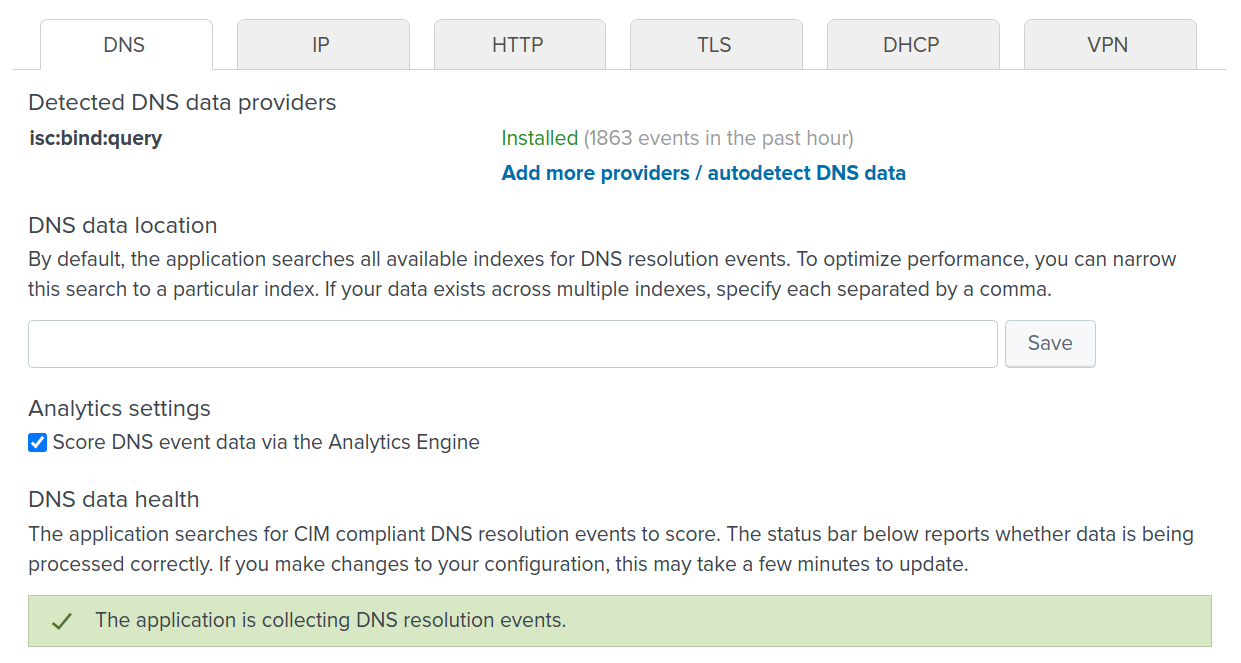
Note: To optimize the searches and make the application more responsive, you may explicitly specify the indexes (comma-delimited) containing the your DNS, IP, and HTTP events within the respective Data location boxes. Once *defined, click Save.
If you run into difficulties configuring your data providers, please contact support@alphasoc.com with a screenshot showing the raw network event data within Splunk (including field names, event types, the sourcetype, and index) and provide a sample of the raw data (e.g. 2MB of firewall or network logs). We can quickly prepare a custom data provider add-on that uses CIM compliant field names for you.
Configuring Groups
Groups allow you to filter networks and systems within the product UI. Upon configuring groups, define the IP ranges of the systems in- and out-of-scope, and trusted destinations, as below.

Use the panel to define:
- The group name (an arbitrary label describing the group)
- IP ranges of the systems in the group (using CIDR notation, such as 10.10.0.0/16)
- Excluded IPs to be ignored, such as those generating noise (e.g. 10.10.0.15)
- Internal domains and destinations that are trusted (e.g. *.example.org or pool.ntp.org)
- Trusted destination IP ranges (e.g. your Internet office IP range)
By defining the systems that are in-scope to be monitored, and whitelisting domains and IP destinations, you can tightly control the material that is sent to the AlphaSOC Analytics Engine for scoring. You can easily define a monitoring scope to send only Internet-bound events to the analytics stack for processing, for example.
Note: Use the Exclusions tab to suppress processing of events from mail servers, proxy servers, recursive resolvers, and other systems which either repeat DNS queries that you are capturing elsewhere, or generate unwanted noise within the dashboards. The Analytics Engine is geared towards identifying threats and infected hosts within endpoints (workstations, laptops, and mobile devices) in particular.
Using the App
Once configured, there are nine tabs within the application:
- Threat Hunter, used to show anomalies indicative of threats and issues requiring investigation
- Policy Violations, used to show items such as unwanted programs, P2P activity, etc.
- Data Explorer, used to display all alerts dive-into the individual threat categories
- Performance, which provides network statistics and charts for your environment
- Search, which is the regular Splunk search dialog applied to the app's dataset
- Groups, used to define your environment, trusted domains, and IP ranges
- Data Location, where data providers are configured and the apps health is shown
- Settings, where the Analytics Engine configuration and escalation paths are set
- Licensing, which displays the daily unique endpoint count (used for licensing purposes)
The Threat Hunter view shows anomalies requiring investigation, as shown:

Note: If at this point the Threat Hunter and Performance views are blank, there is likely a problem with your data provider add-on configuration. Review provider add-on health under Data Location and ensure that events are being ingested by the app. If you have problems at this point, please contact support@alphasoc.com for assistance.
Saved Searches
Network Behavior Analytics for Splunk periodically runs the following searches every few minutes to gather data for analysis:
search $INDEX tag="dns" tag="network" tag="resolution" _indextime > $FROM _indextime <= $TO
search $INDEX tag="network" tag="communicate" _indextime > $FROM _indextime <= $TO
search $INDEX tag="web" _indextime > $FROM _indextime <= $TO
search $INDEX tag="network" tag="session" tag="dhcp" _indextime > $FROM _indextime <= $TO
search $INDEX tag="certificate" _indextime > $FROM _indextime <= $TO
search $INDEX tag="network" tag="session" tag="vpn" _indextime > $FROM _indextime <= $TO
where $INDEX is index=* by default and may be changed via Settings ->
Data location to define a particular index, and $FROM, $TO are internal
markers which keep track of the processed data. Usually a time range defined
by them is a few minutes. When first run, data indexed less than 30 minutes
ago will be retrieved.
Network Behavior Analytics for Splunk also defines a saved search which isn't scheduled to run by default and is enabled to run once every 5 minutes when third-party integrations for incident escalation are enabled under the Settings tab. This search is as follows:
`nbaeventsindex` type=alert threats=*
| mvexpand threats
| eval group=mvjoin(mvsort(if(isnull(src_groups), "-", src_groups)), ", ")
| lookup asocnbathreats name AS threats OUTPUT title, severity, show, policy
| eval show=if(isnull(show), 1, show)
| eval policy=if(isnull(policy), 0, policy)
| search title=* show=1 policy=0 severity>=2
| eval c_time=strftime(strptime(original_event, "%d-%b-%Y %H:%M:%S%z"), "%d-%b-%Y %H:%M:%S")
| sort 0 -severity
| streamstats count by src_ip, group
| stats latest(c_time) AS "time", dc(title) AS "total_threats", list(eval(if(count<=1,title,null()))) AS "top_threat", max(severity) AS "severity" by src_ip, group
| rename src_ip AS source
| sort by -severity, -time
Where `nbaeventsindex` is a macro defining data location index (index=*
by default). The above search retrieves generated alerts and returns the
following fields which may be used by various third-party integrations:
source, group, time, total_threats, policy, severity, and
top_threat.
Raw Alert Format
Alert data is stored in CIM format within the main index by default. The
alert index can be updated via the Data Location tab, and as such, as use a
macro called `nbaeventsindex` to track the index within the app. The
Threat Hunter, Policy Violations, and other views within the app render
data from this macro. You may manually review the contents of the index
within Splunk by using the following search:
`nbaeventsindex` type=alert
Which should return raw alert data that you can manipulate and use:
