Splunk
Overview
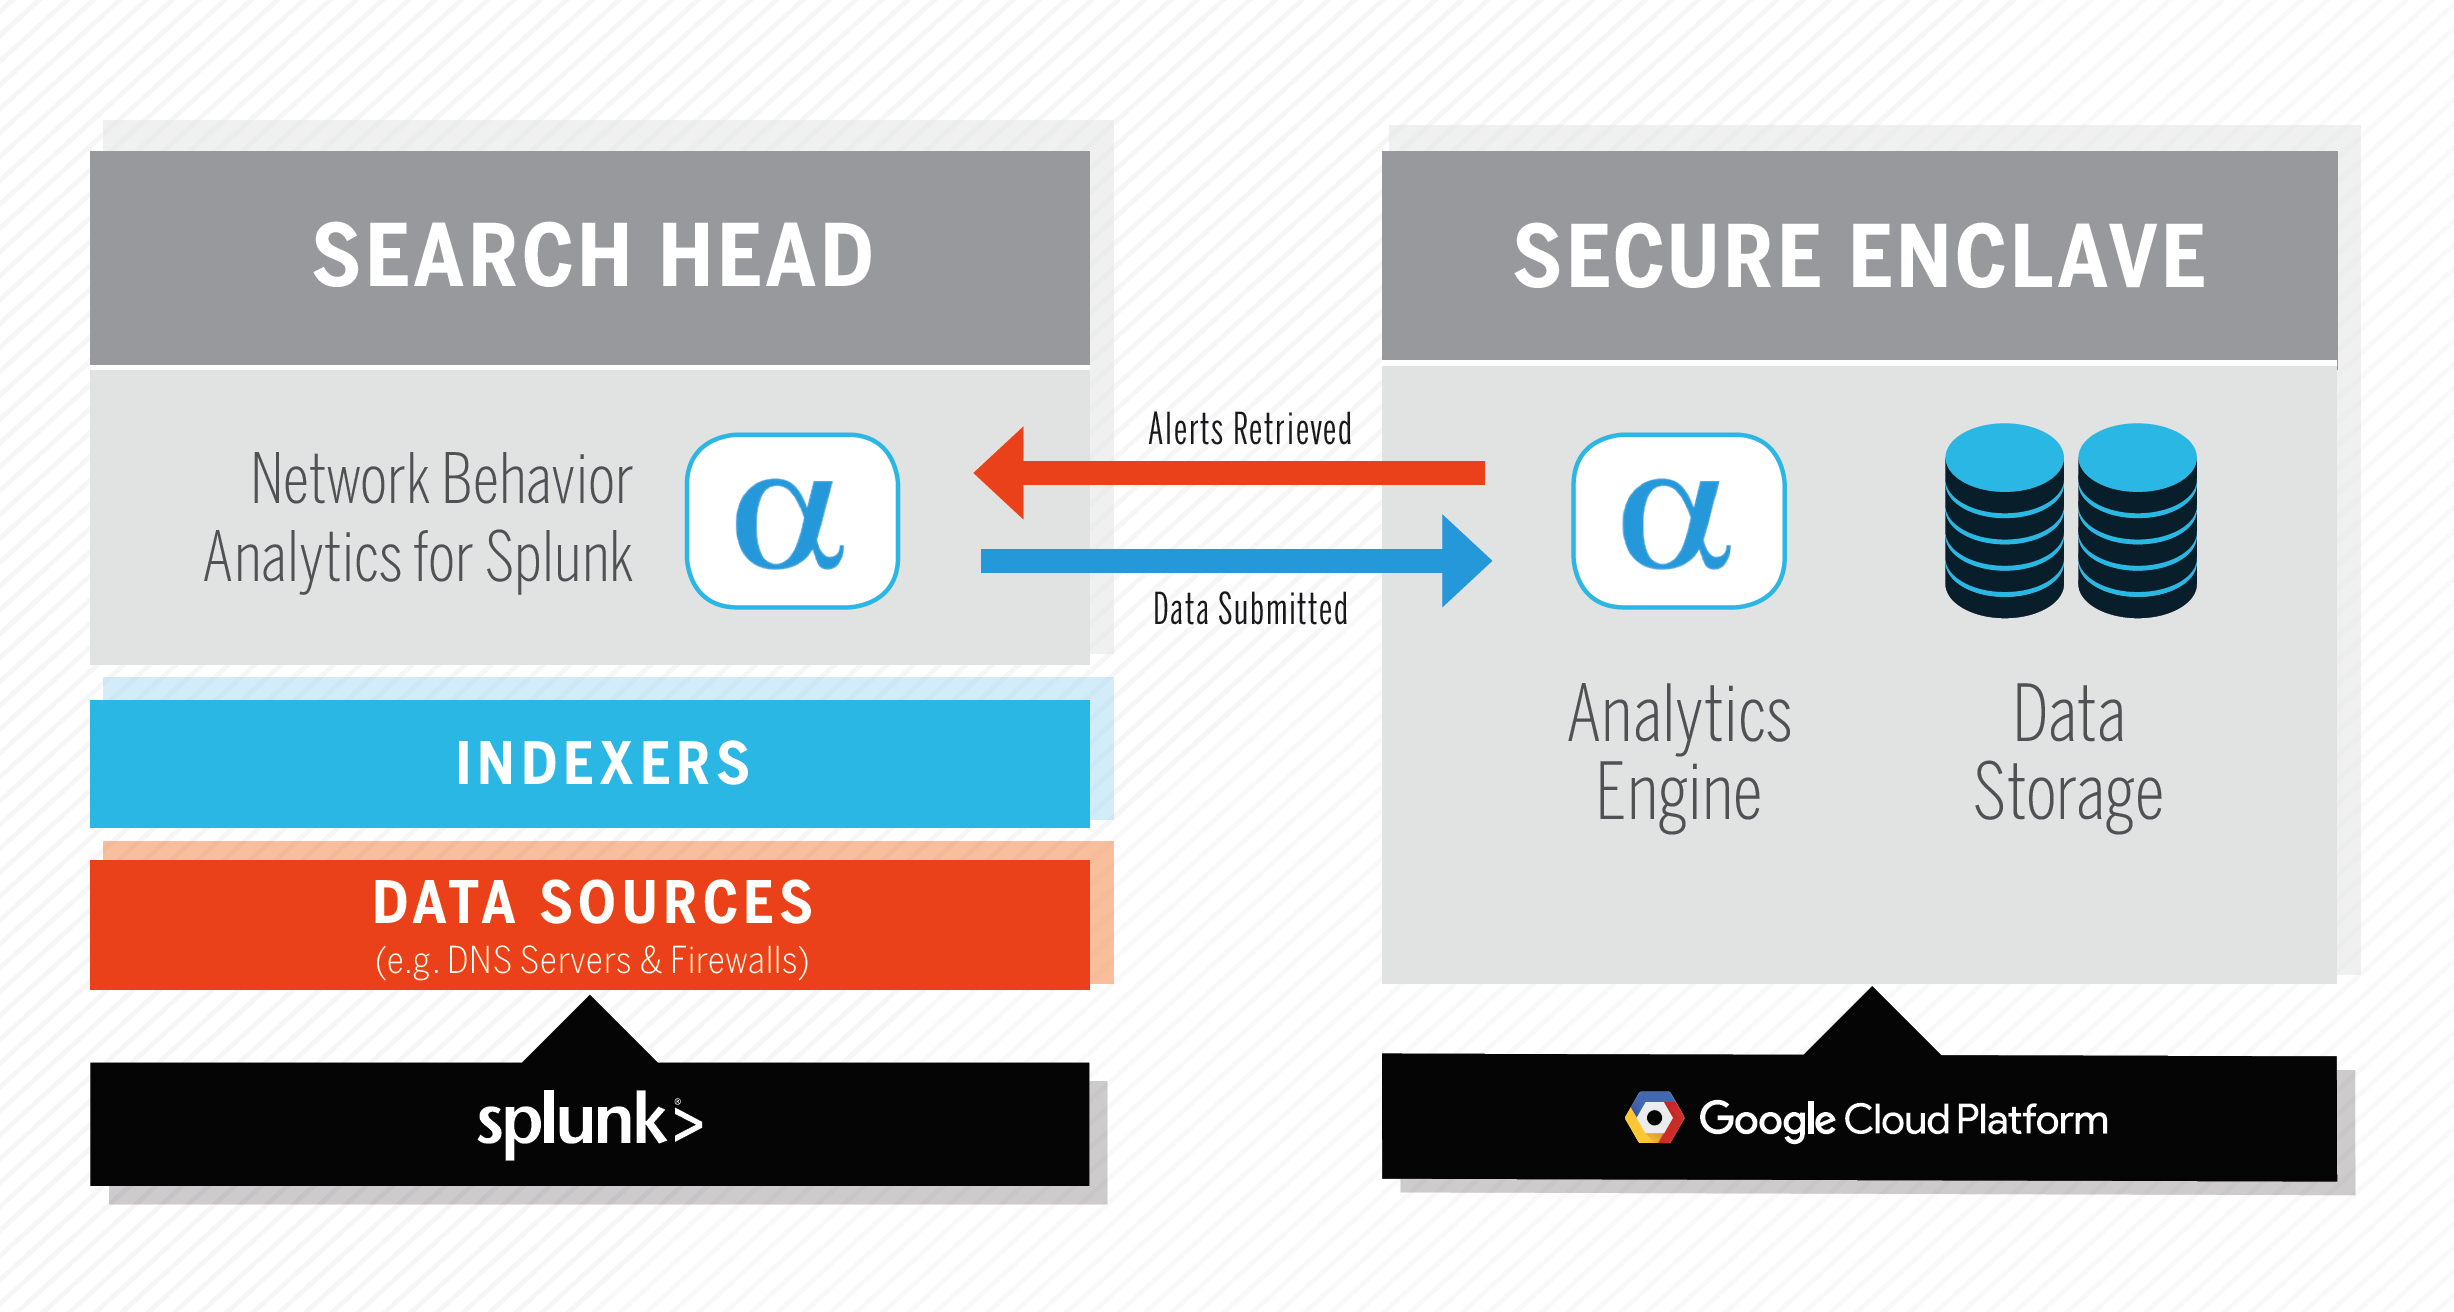
This document outlines the process for submitting network telemetry to AlphaSOC, including CIM-compliant DNS, HTTP, IP, and TLS events for scoring and retriving security alerts. By following this short guide, you'll be able to configure Network Behavior Analytics for Splunk to submit your logs to the AlphaSOC Analytics Engine for analysis. The system architecture is shown below.
Product Installation
Pre-Installation Checklist
Before installing Network Behavior Analytics for Splunk, please ensure:
- You are indexing egress network events within your Splunk environment.
- Your Search Head can access api.alphasoc.net via HTTPS (TCP port 443).
- You have administrative privileges within Splunk.
DNS resolution events may be obtained from your name servers, full-packet capture (e.g. Zeek or Suricata), or infrastructure processing outbound HTTP requests (e.g. Blue Coat ProxySG or Zscaler). IP events are commonly logged by firewalls, but may be obtained from IDS logs, Splunk Stream, or other sources.
Installing Network Behavior Analytics for Splunk
Install the application within Splunk by browsing to Apps > Manage Apps > Browse More Apps, and searching for Network Behavior Analytics, or downloading the package from Splunkbase and uploading to your Search Head. Follow the on-screen installation steps and restart Splunk.
API Key Generation
The first time that you run Network Behavior Analytics for Splunk, the app will contact our licensing server to provision an API key. Upon generating a key, verify your email address to view alerts and use the dashboards. An activated API key is unrestricted for 30 days for evaluation purposes.
Adhere to the terms of service and generate an API key as follows:
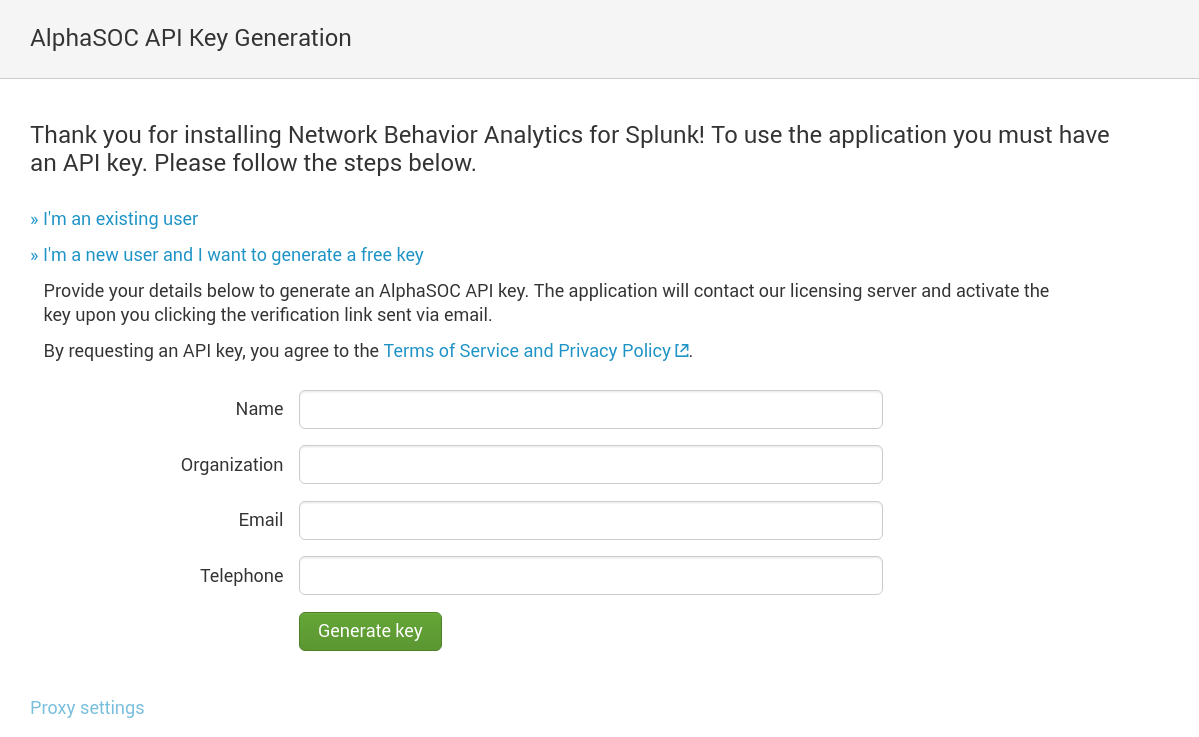
If you are an existing AlphaSOC customer, select I'm an existing user to reset or provide your AlphaSOC API key to complete installation. Please contact support@alphasoc.com if you run into any difficulties.
Configuring Data Providers
Once installed, click into the Data Location tab within the app to configure data providers.
If you already use a CIM compliant add-on to index your DNS, IP, and HTTP network events, the app will automatically load the events and further configuration is not required. If you are not using a CIM compliant add-on, one must be configured to load data for scoring.
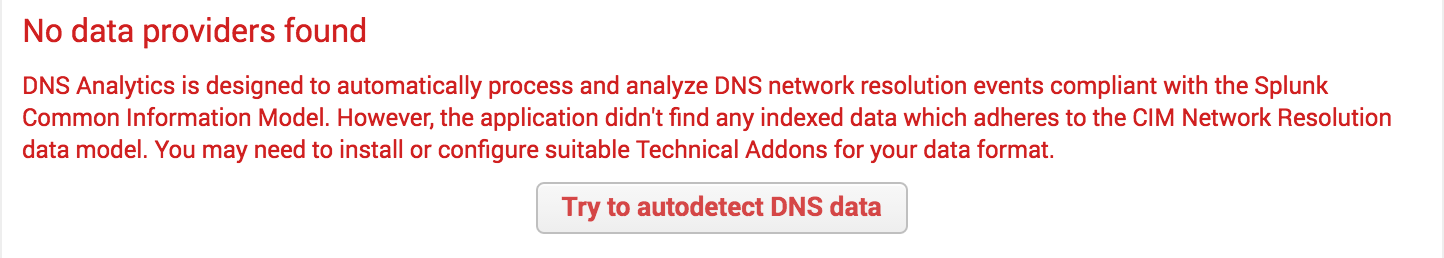
On the left side of the screen, you will see tabs for the different telemetry types that the Splunk app can process (e.g. DNS, IP, HTTP, TLS). As you click into each, the app will display the data provider health and number of events. The autodetect feature will provide you with next steps if no data is found:
If things are configured correctly, the app will show that it is collecting events:
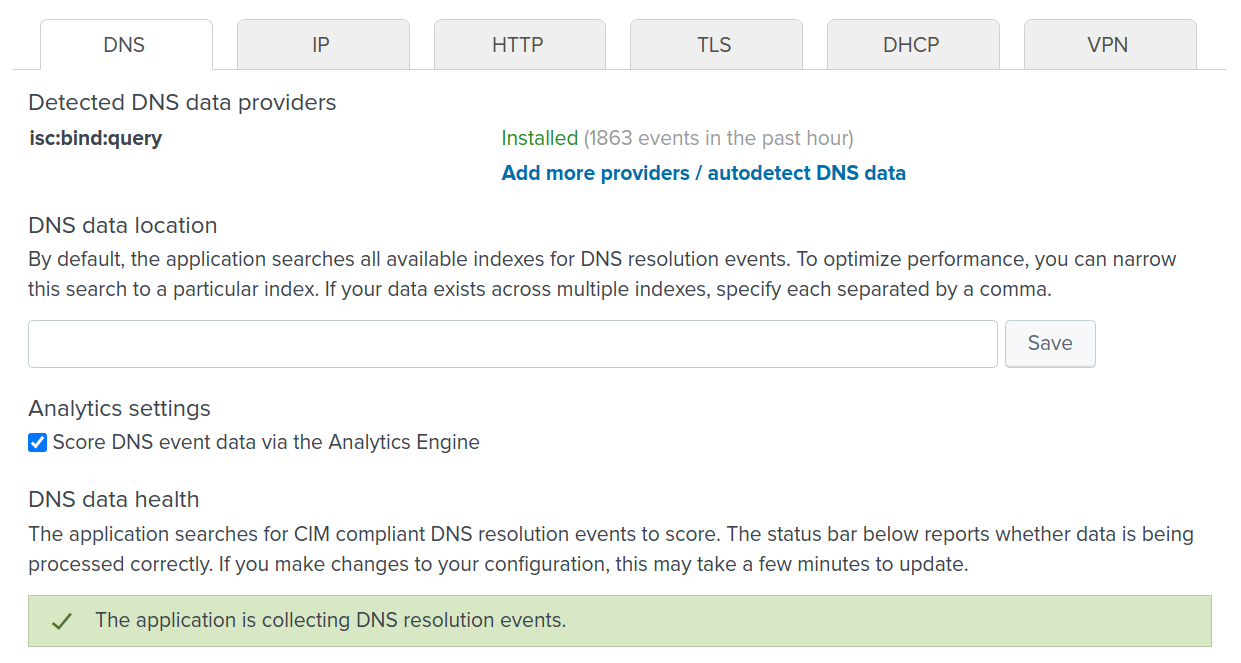
Note: To optimize the searches and make the application more responsive, you may explicitly specify the indexes (comma-delimited) containing your DNS, IP, and HTTP events within the respective Data Location boxes. Once it is defined, click Save.
If you run into difficulties configuring your data providers, please contact support@alphasoc.com with a screenshot showing the raw network event data within Splunk (including field names, event types, the sourcetype, and index) and provide a sample of the raw data (e.g. 2MB of firewall or network logs). We can quickly prepare a custom data provider add-on that uses CIM compliant field names for you.
Supported Data Types
Network Behavior Analytics for Splunk periodically runs the following searches
every few minutes to gather data for analysis. $INDEX is index=* by default
and may be changed via Settings > Data Location to define a particular
index, and $FROM, $TO are internal markers which keep track of the processed
data. Usually a time range defined by them is a few minutes. When first run,
data indexed less than 30 minutes ago will be retrieved.
DHCP
search $INDEX tag="network" tag="session" tag="dhcp" _indextime > $FROM _indextime <= $TO
| Field name | Data type | Example value | Mandatory | Description |
|---|---|---|---|---|
| _time | integer | 1585836536 | ✔ | Original event timestamp |
| _indextime | integer | 1585836628 | ✔ | Time the event was indexed |
| dest_ip / dest | ip address | 192.168.0.1 | ✔ | IP address leased to the client |
| dest_nt_host | text | johns-mbp | Hostname of the client initializing a lease | |
| dest_mac | text | d6:75:9b:cb:78:06 | MAC address of the client acquiring a lease | |
| user | text | john | Name of the user acquiring a lease | |
| signature / msg_types / msdhcp_id | text | dhcpack | ✔ | Type of the DHCP operation |
| lease_duration | integer | 3600 | The duration of the DHCP lease, in seconds |
DNS
search $INDEX tag="dns" tag="network" tag="resolution" _indextime > $FROM _indextime <= $TO
| Field name | Data type | Example value | Mandatory | Description |
|---|---|---|---|---|
| _time | integer | 1585836536 | ✔ | Original event timestamp |
| _indextime | integer | 1585836628 | ✔ | Time the event was indexed |
| src_ip / src | ip address | 192.168.0.1 | ✔ | Client IP of the source |
| src_port | integer | 45060 | Client port of the source | |
| src_host / src_nt_host | text | johns-mbp | Hostname of the source | |
| src_mac | text | d6:75:9b:cb:78:06 | MAC address of the source | |
| src_user / user | text | john | Name of the user generating event | |
| query | fqdn | www.google.com | ✔ | DNS query |
| record_type | record type | A | DNS query record type | |
| reply_code / reply_code_id | text | 3 | DNS return code |
HTTP
search $INDEX tag="web" _indextime > $FROM _indextime <= $TO
| Field name | Data type | Example value | Mandatory | Description |
|---|---|---|---|---|
| _time | integer | 1585836536 | ✔ | Original event timestamp |
| _indextime | integer | 1585836628 | ✔ | Time the event was indexed |
| src_ip / src | ip address | 192.168.0.1 | ✔ | Client IP of the source |
| src_port | integer | 45060 | Client port of the source | |
| src_host / src_nt_host | text | johns-mbp | Hostname of the source | |
| src_mac | text | d6:75:9b:cb:78:06 | MAC address of the source | |
| src_user / user | text | john | Name of the user generating event | |
| url / site | url | https://google.com/search | ✔ | URL of the requested HTTP resource |
| app | text | tls | Application protocol of the network traffic | |
| action | text | allowed | Action taken by the network device | |
| status | integer | 200 | HTTP response code | |
| bytes_in | integer | 8910 | Bytes received by this source | |
| bytes_out / bytes | integer | 32896 | Bytes transmitted by this source | |
| http_content_type | text | application/json | Content-type of the requested HTTP resource | |
| http_method | text | POST | HTTP method | |
| http_referrer / http_referer | url | https://google.com/redirect | HTTP referrer | |
| http_user_agent | text | Mozilla/5.0 (X11; Linux x86_64) | HTTP user agent |
IP
search $INDEX tag="network" tag="communicate" _indextime > $FROM _indextime <= $TO
| Field name | Data type | Example value | Mandatory | Description |
|---|---|---|---|---|
| _time | integer | 1585836536 | ✔ | Original event timestamp |
| _indextime | integer | 1585836628 | ✔ | Time the event was indexed |
| src_ip / src | ip address | 192.168.0.1 | ✔ | Client IP of the source |
| src_port | integer | 45060 | Client port of the source | |
| src_host / src_nt_host | text | johns-mbp | Hostname of the source | |
| src_mac | text | d6:75:9b:cb:78:06 | MAC address of the source | |
| src_user / user | text | john | Name of the user generating event | |
| dest_ip / dest | ip address | 8.8.8.8 | ✔ | Destination IP address of the network traffic |
| dest_port | integer | 443 | Destination port of the network traffic | |
| transport | text | tcp | OSI layer 4 (transport) protocol of the network traffic | |
| bytes_in | integer | 8910 | Bytes received by this source | |
| bytes_out / bytes | integer | 32896 | Bytes transmitted by this source | |
| app | text | tls | Application protocol of the network traffic | |
| action | text | allowed | Action taken by the network device | |
| duration | float | 3.8136 | Time for the completion of network event (in seconds) |
TLS
search $INDEX tag="certificate" _indextime > $FROM _indextime <= $TO
| Field name | Data type | Example value | Mandatory | Description |
|---|---|---|---|---|
| _time | integer | 1585836536 | ✔ | Original event timestamp |
| _indextime | integer | 1585836628 | ✔ | Time the event was indexed |
| src_ip / src | ip address | 192.168.0.1 | ✔ | Client IP of the source |
| src_port | integer | 45060 | Client port of the source | |
| src_host / src_nt_host | text | johns-mbp | Hostname of the source | |
| src_mac | text | d6:75:9b:cb:78:06 | MAC address of the source | |
| src_user / user | text | john | Name of the user which generated this event | |
| dest_ip / dest | ip address | 8.8.8.8 | Destination IP address of the network traffic | |
| dest_port | number | 443 | Destination port of the network traffic | |
| ssl_hash / ssl_cert_sha1 | sha1 | 0db6495611891de35650a18ad91002845f9cc6bc | Hash (sha1) of the certificate | |
| ssl_issuer | text | CN=GTS CA,O=Google Trust Services,C=US | Certificate issuer's RFC2253 Distinguished Name | |
| ssl_subject | text | CN=motd.ubuntu.com | Certificate subject using RFC2253 Distinguished Name | |
| ssl_start_time | integer | 1578079563 | Start date for the certificate's validity (in unix time) | |
| ssl_end_time | integer | 1588447563 | End date for the certificate's validity (in unix time) | |
| ja3 | md5 | 0b2a5b08a7c44adaeaa1c0d29493c409 | Client fingerprint hash (md5) | |
| ja3s | md5 | 254c31292ed05b84addc077fe6cee283 | Server fingerprint hash (md5) |
VPN
search $INDEX tag="network" tag="session" tag="vpn" _indextime > $FROM _indextime <= $TO
| Field name | Data type | Example value | Mandatory | Description |
|---|---|---|---|---|
| _time | integer | 1585836536 | ✔ | Original event timestamp |
| _indextime | integer | 1585836628 | ✔ | Time the event was indexed |
| dest_ip / dest | ip address | 192.168.0.1 | ✔ | Internal IP address assigned to the client |
| dest_nt_host | text | johns-mbp | Hostname of the client | |
| dest_mac | text | d6:75:9b:cb:78:06 | MAC address of the client | |
| user | text | john | Name of the user (client side) |