KQL Search
KQL (Kusto Query Language) is a read-only query language that lets you explore
your data in the AlphaSOC Security Data Lake. A query starts from one dataset
and passes its rows through a chain of steps joined by |. AlphaSOC KQL Search
runs KQL over your workspace's data: the observations, activity, and normalized
events AlphaSOC processed. You can run queries on the Search page of the console, or let an
AI agent run them through the MCP server.
KQL Search is an early version and is actively developed. Language support and performance are still limited and will improve in future releases.
Requires an active AE license.
Hunt and investigate
KQL Search gives your analysts and AI agents direct access to telemetry normalized to OCSF, for threat hunting and investigations. With it you can:
- Confirm whether an indicator from an alert or a threat report, such as a domain, IP address, URL, hash, or certificate, ever appeared in your environment.
- Trace the devices, users, processes, and log sources behind it.
- Scope an incident by following one device or user, down to the original raw log line.
- Hunt across all your sources with the same OCSF field names, without learning each log format.
- Export results to attach to a case or share with your team.
Where you can run KQL
In the console
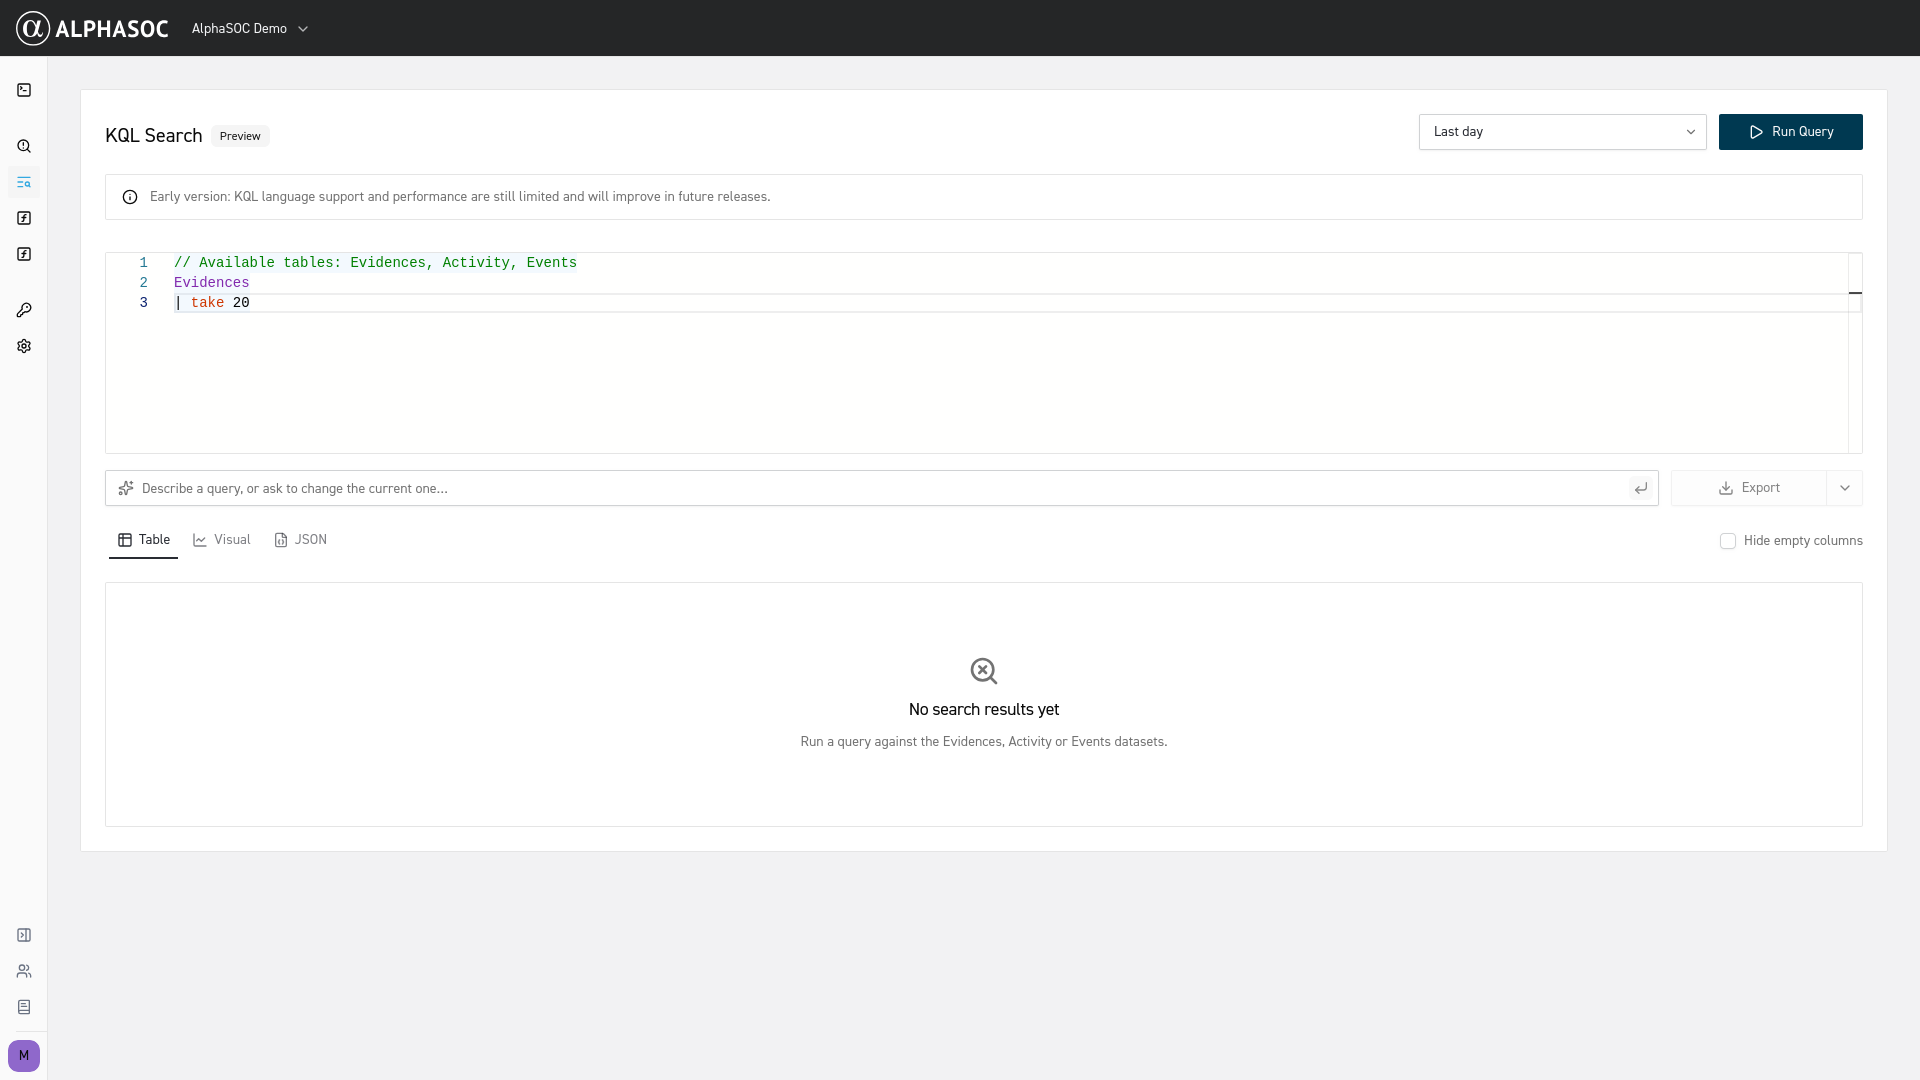
Open the Search page in the console.
-
Datasets:
Evidences,Activity, andEvents. -
Editor: completes dataset names and top-level column names. Errors are marked in the editor at the part of the query that caused them.
-
Time range: the picker defaults to the last day and offers presets from 5 minutes to 3 months, plus relative and custom ranges. See Time range.
-
Run: select Run Query or press Ctrl+Enter (Cmd+Enter on macOS).
-
AI prompt: describe a query in plain language, or ask to change the current one. The prompt writes the query into the editor and may change the time range, but it does not run the query. Review the query before running it.
-
Results: three views of the same rows.
- Table: shows rows as the query returns them. Expand a row to see all its values, or show it as JSON to see the full row. You can also hide empty columns.
- Visual: draws charts for queries that end with
render. - JSON: shows each row as one line of JSON. Expand a row to see the full JSON, and add any value to the summary line.
Add as filter on a value adds a
whereline for it at the end of the query, or beforerenderwhen the query has one. -
Query stats: Execution Time, Rows Scanned, Rows Returned, and a Results truncated badge when the result is incomplete.
-
Export: JSONL (default), JSON, or CSV.
Through the MCP server
An AI agent connected to the AlphaSOC MCP server can run KQL over Evidences,
Activity, Events, and also Findings. The agent looks up the columns of
each dataset and reads the KQL guides on its own, so you ask in plain language
and it writes and runs the queries.
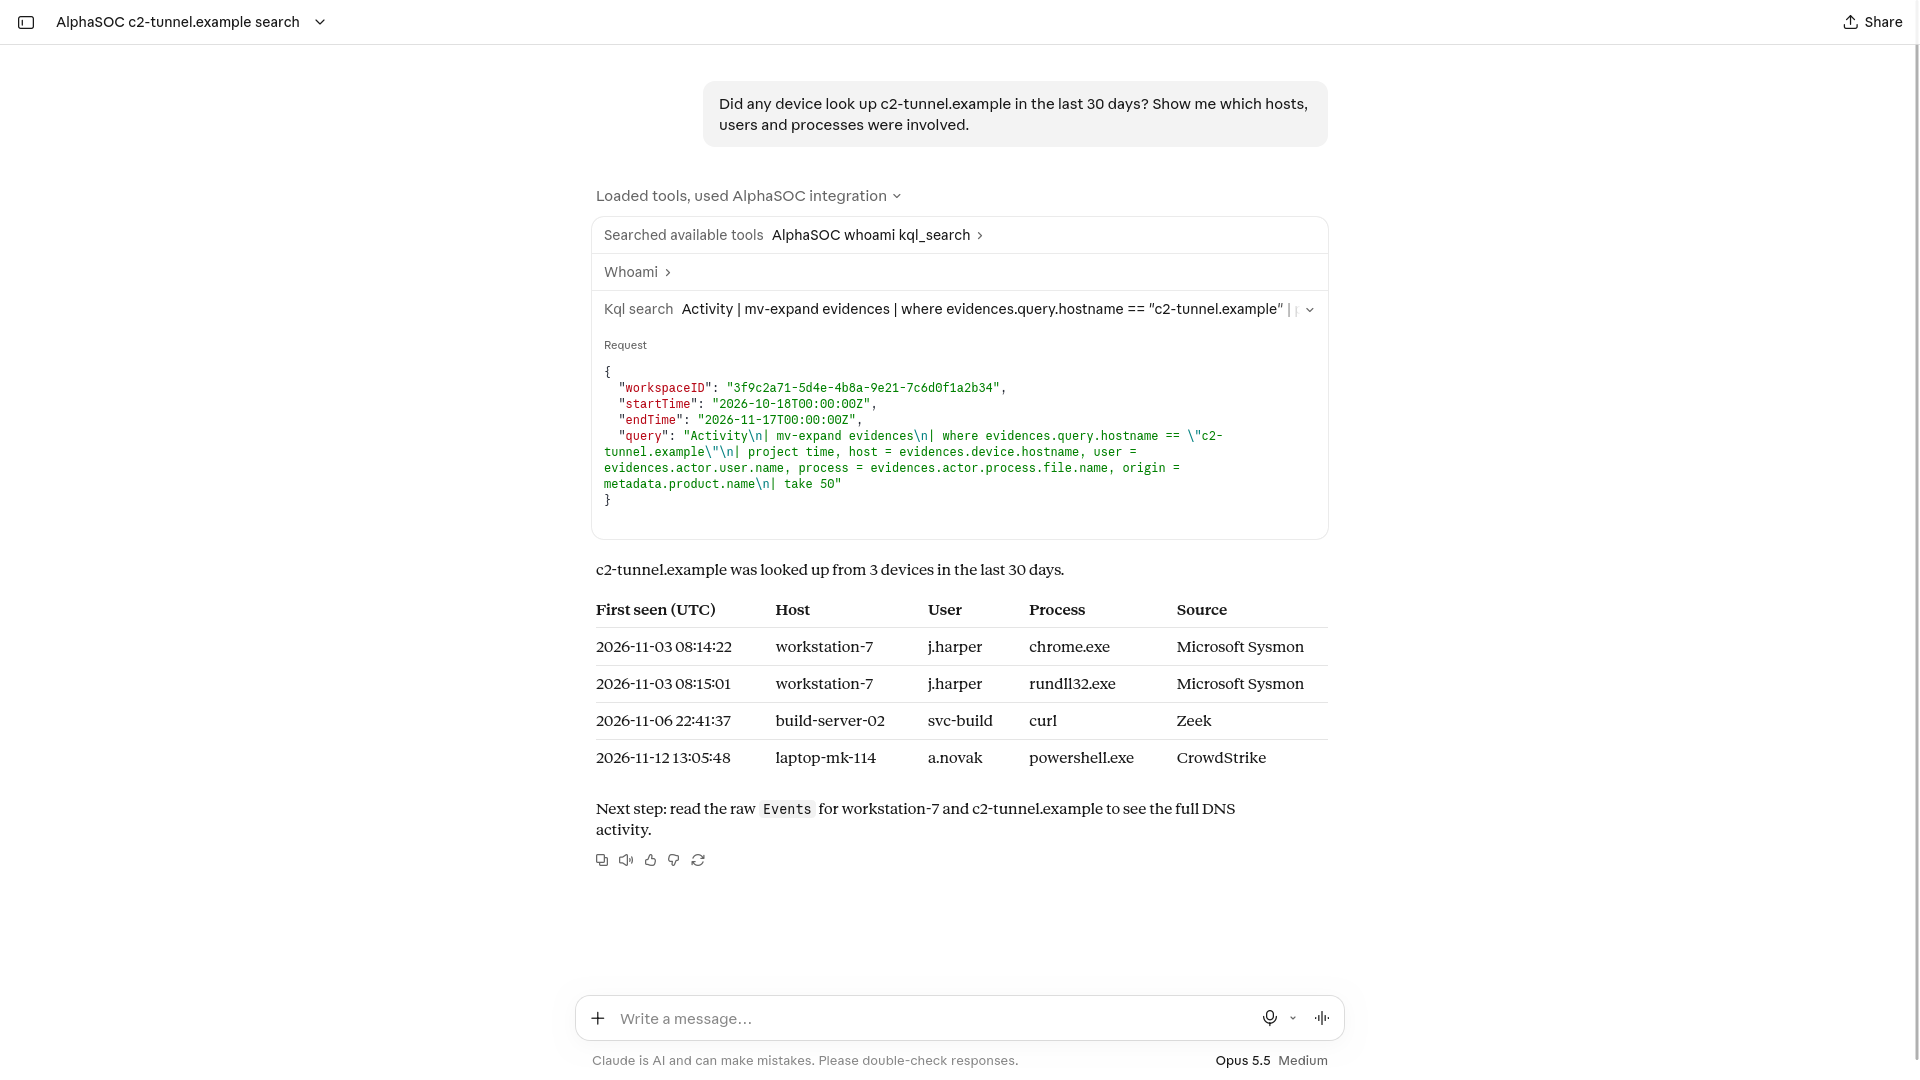
See the MCP server introduction for setup and access, and Findings & Telemetry for how the agent chooses between KQL and the other tools.
Datasets
| Dataset | One row is | Use it for | Kept for | Available in |
|---|---|---|---|---|
Evidences | One observation AlphaSOC saw and submitted for analysis: a DNS lookup, IP connection, HTTP request, TLS certificate, and more | Checking whether an indicator was ever seen. The cheapest dataset. | 90 days | Console, MCP |
Activity | The same observation, with the device, user, process, and log source behind it | Finding who looked something up, and from where | 90 days | Console, MCP |
Events | One normalized log record in OCSF form, including the original raw log line | Seeing what exactly a device, user, or indicator did | 30 days | Console, MCP |
Findings | One OCSF Detection Finding row: a detection with severity and MITRE ATT&CK, or the sampled events of a finding | Seeing what AlphaSOC detected | 90 days | MCP only |
- Columns follow OCSF. See OCSF field mappings
for the field paths, and OCSF Detection Finding
for
Findingsfields. EvidencesandActivitykeep each observation in an array column namedevidences. Queries expand it first withmv-expand evidences.Evidenceshas no device or user. UseActivityfor those. Neither dataset has verdicts; AlphaSOC verdicts are inFindings.- In
Evidences,timeis when AlphaSOC recorded the observation, which is usually later than the activity itself. UseActivityorEventsfor a timeline.
Time range
Every query runs inside the time range set by the time picker, not by the query
text. A where on time can narrow the range but never widen it.
Events can reach AlphaSOC late and out of order, so the time AlphaSOC received data can differ from the time the event happened. Each dataset applies the range to one of these times:
| Dataset | The range applies to | Event time is in |
|---|---|---|
Evidences | When AlphaSOC received the observation | Not stored. time is when AlphaSOC received it. |
Activity | When AlphaSOC received the observation | time, when the source reported one |
Events | The event time | time |
Findings | When AlphaSOC created the finding (time) | start_time and end_time (first and last event) |
- On
EvidencesandActivity, the range is applied coarsely, so a few rows just outside the range can appear. OnActivity,timeis the event time, so it can be well outside the range when the event arrived late. Add awhereontimefor an exact cut (see Filter and group by time). - On
Events, the range is exact for each row. An event that reached AlphaSOC more than about two hours after the end of the range is not returned. Move the end of the range later to include it. - A preset such as "Last day" is turned into fixed start and end times when you pick it. Running the query again uses the same times. To include data that arrived since, open the time picker and select Jump to now (the arrow button next to the range preview).
Your first investigation
Say a threat report names the hostname c2-tunnel.example. Open the Search
page in the console, set the time range to the last 30 days (on the Relative tab of the
time picker), and run these queries
one after another.
-
Check whether the indicator was seen in your telemetry at all.
Evidencesis the quickest place to look.Evidences
| mv-expand evidences
| where evidences.query.hostname == "c2-tunnel.example"
| project time, hostname = evidences.query.hostname, type = evidences.query.type
| take 20 -
Find who interacted with it: the device, user, process, and log source behind each lookup.
Activity
| mv-expand evidences
| where evidences.query.hostname == "c2-tunnel.example"
| project time, host = evidences.device.hostname, user = evidences.actor.user.name, process = evidences.actor.process.file.name, origin = metadata.product.name
| take 50 -
Read the raw DNS events for one device from step 2, here
workstation-7, to see exactly what happened.class_uid == 4003keeps only DNS Activity events, the OCSF class of a DNS lookup.Events
| where class_uid == 4003
| where query.hostname == "c2-tunnel.example"
| where device.hostname == "workstation-7"
| project time, origin = metadata.product.name, raw_data
| take 20
== is case-sensitive. To match text in any case or in part, see
Casing.
Limits
- A query reads one dataset; joins are not supported. To correlate datasets, run separate queries.
- A query returns at most 50,000 rows in the console.
- On
Evidences,Activity, andEvents, a query reads about 100,000 rows at most. When a read stops early, the result is marked Results truncated, and counts and other aggregates cover only the rows read. Use a more selective filter or a shorter time range. - An export holds at most 5,000 rows or 10 MB.