AlphaSOC for Splunk
Overview
The AlphaSOC for Splunk app surfaces AlphaSOC findings directly within Splunk.
Use the built-in dashboards to triage threats, investigate entities, and pivot
to raw OCSF findings — all without leaving Splunk. The app also includes the
alphasoc generating command for searching OCSF telemetry in AlphaSOC's data
lake and checking processed event volume.
Installation
Within Splunk Enterprise or Splunk Cloud, click into Apps -> Find more apps
and search for alphasoc to find and install AlphaSOC for Splunk.
The app is also available from Splunkbase here.
Configuration
To connect the AlphaSOC for Splunk app to your Analytics Engine, generate an API key in the AlphaSOC Console and configure it in Splunk. Follow the steps below.
- Navigate to the AlphaSOC Console.
- Go to the Credentials section and click API Keys.
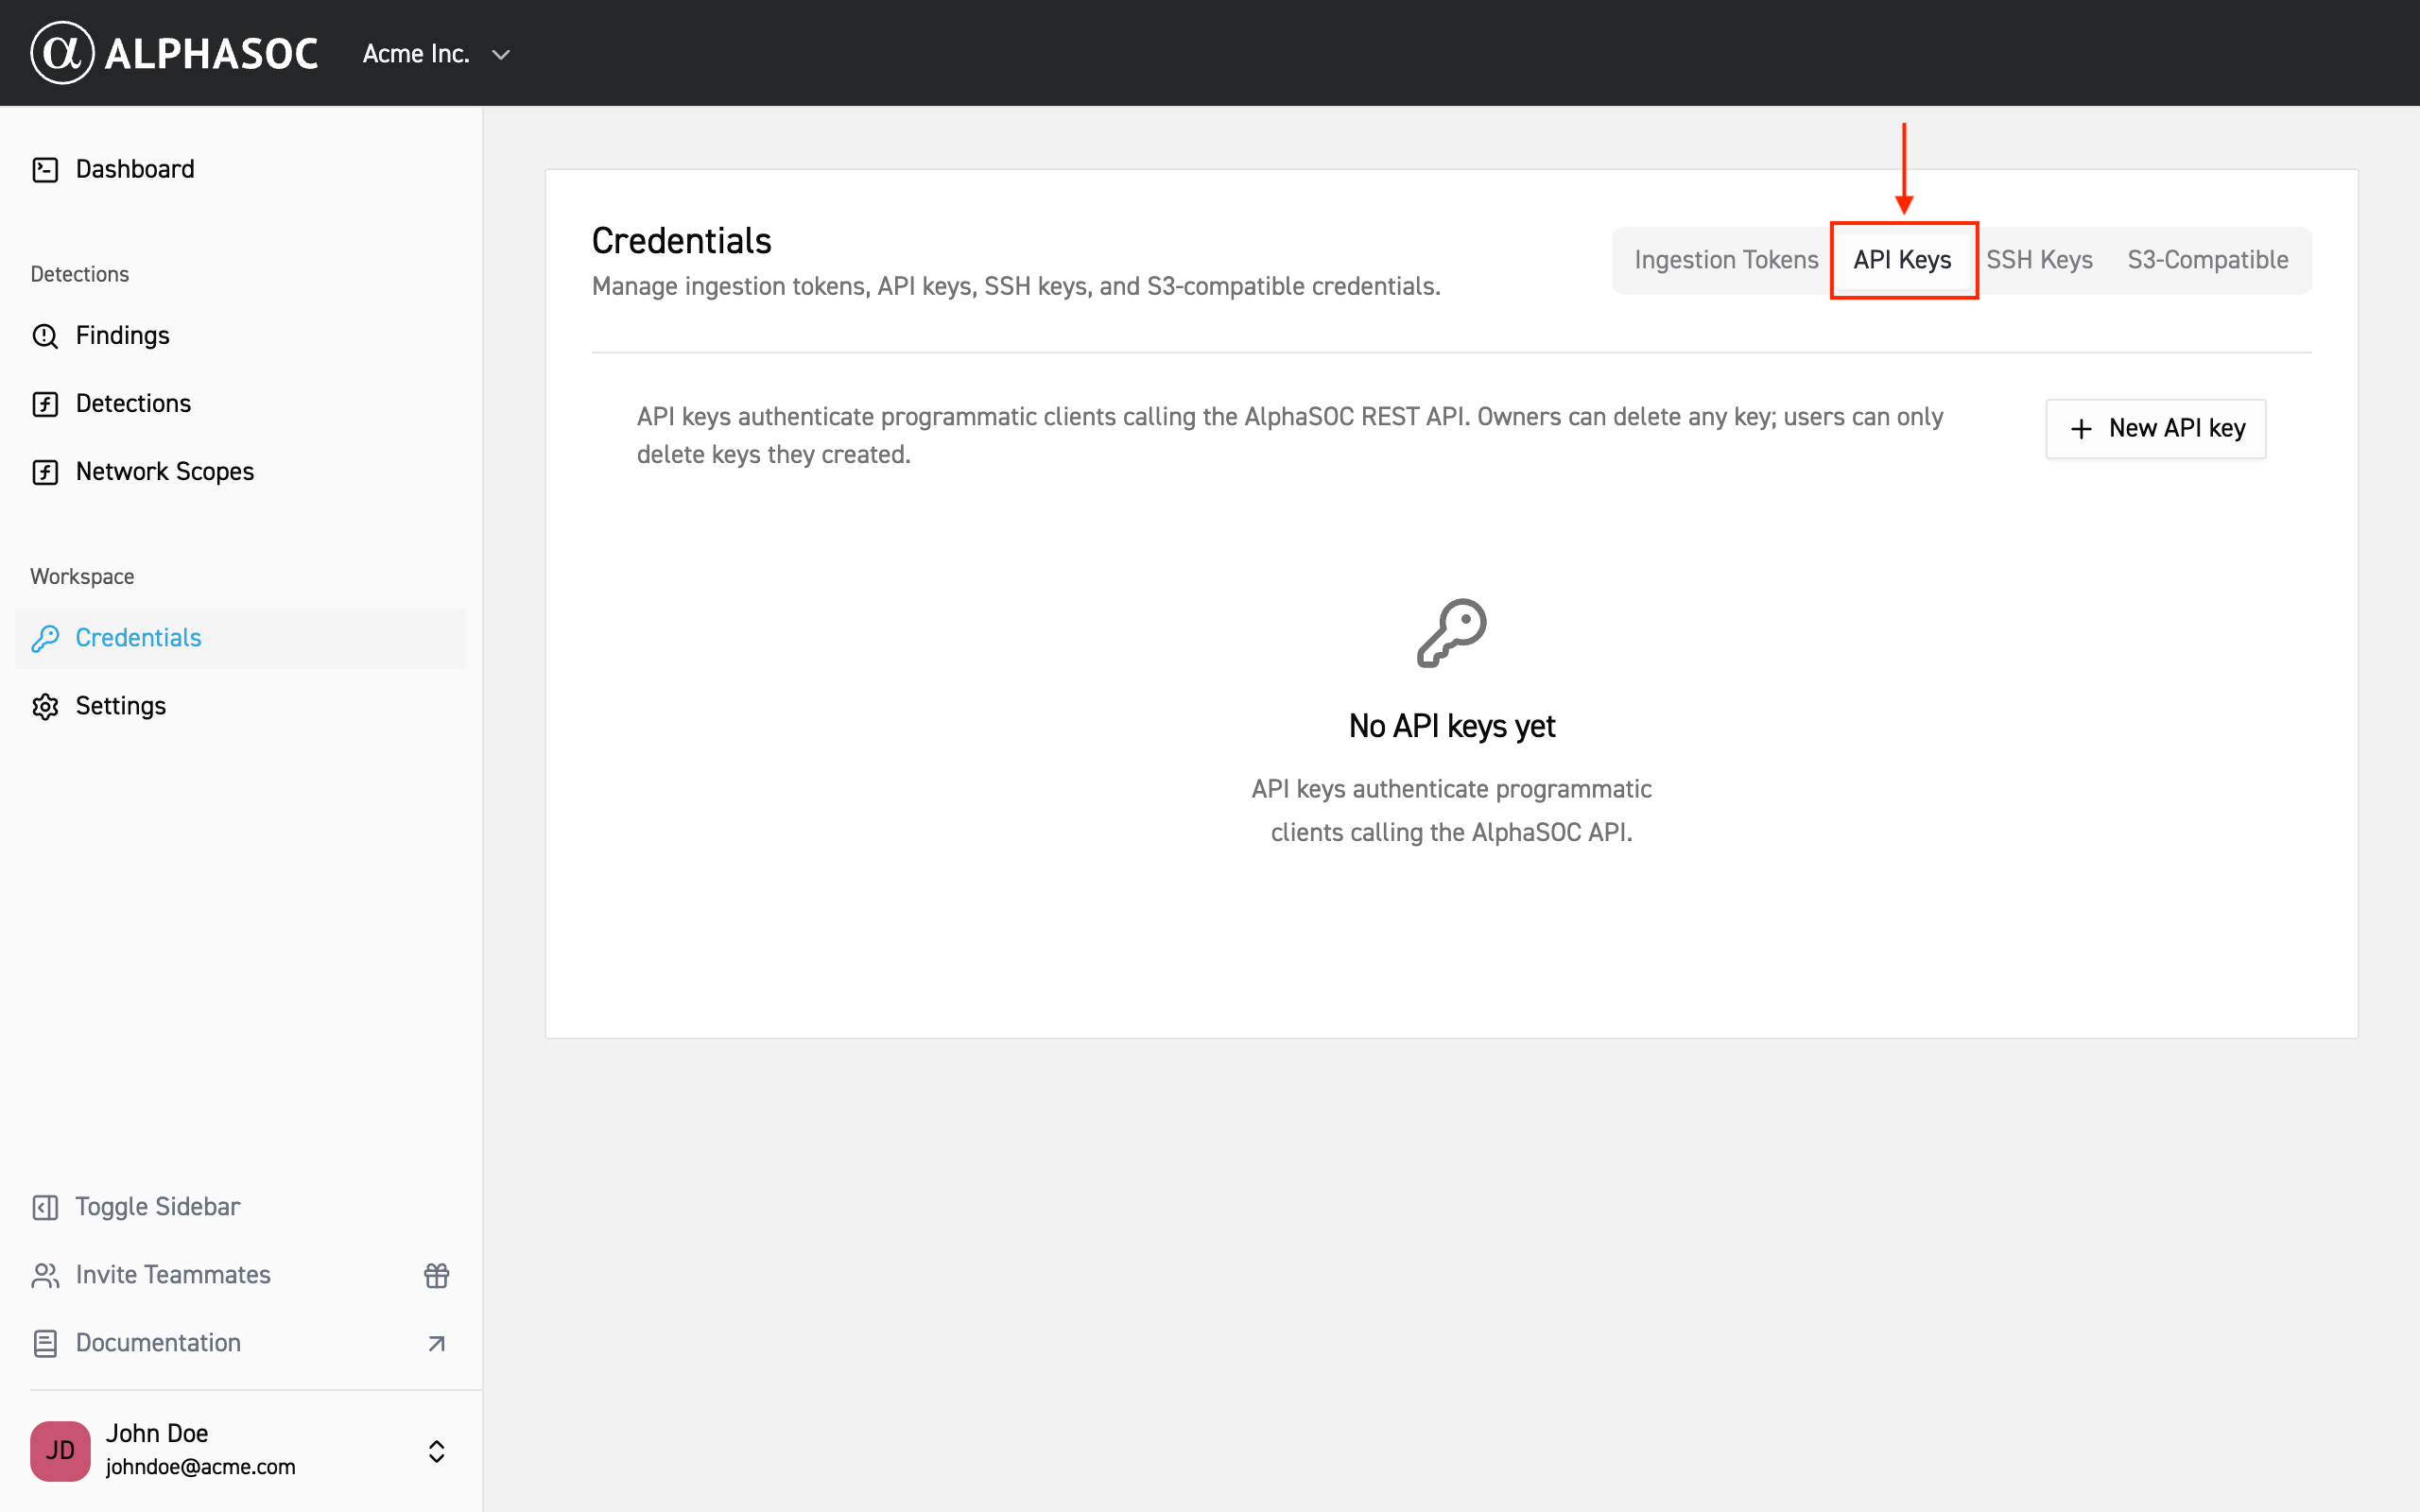
- Click on New API key button and, optionally, provide a description for
the new key.
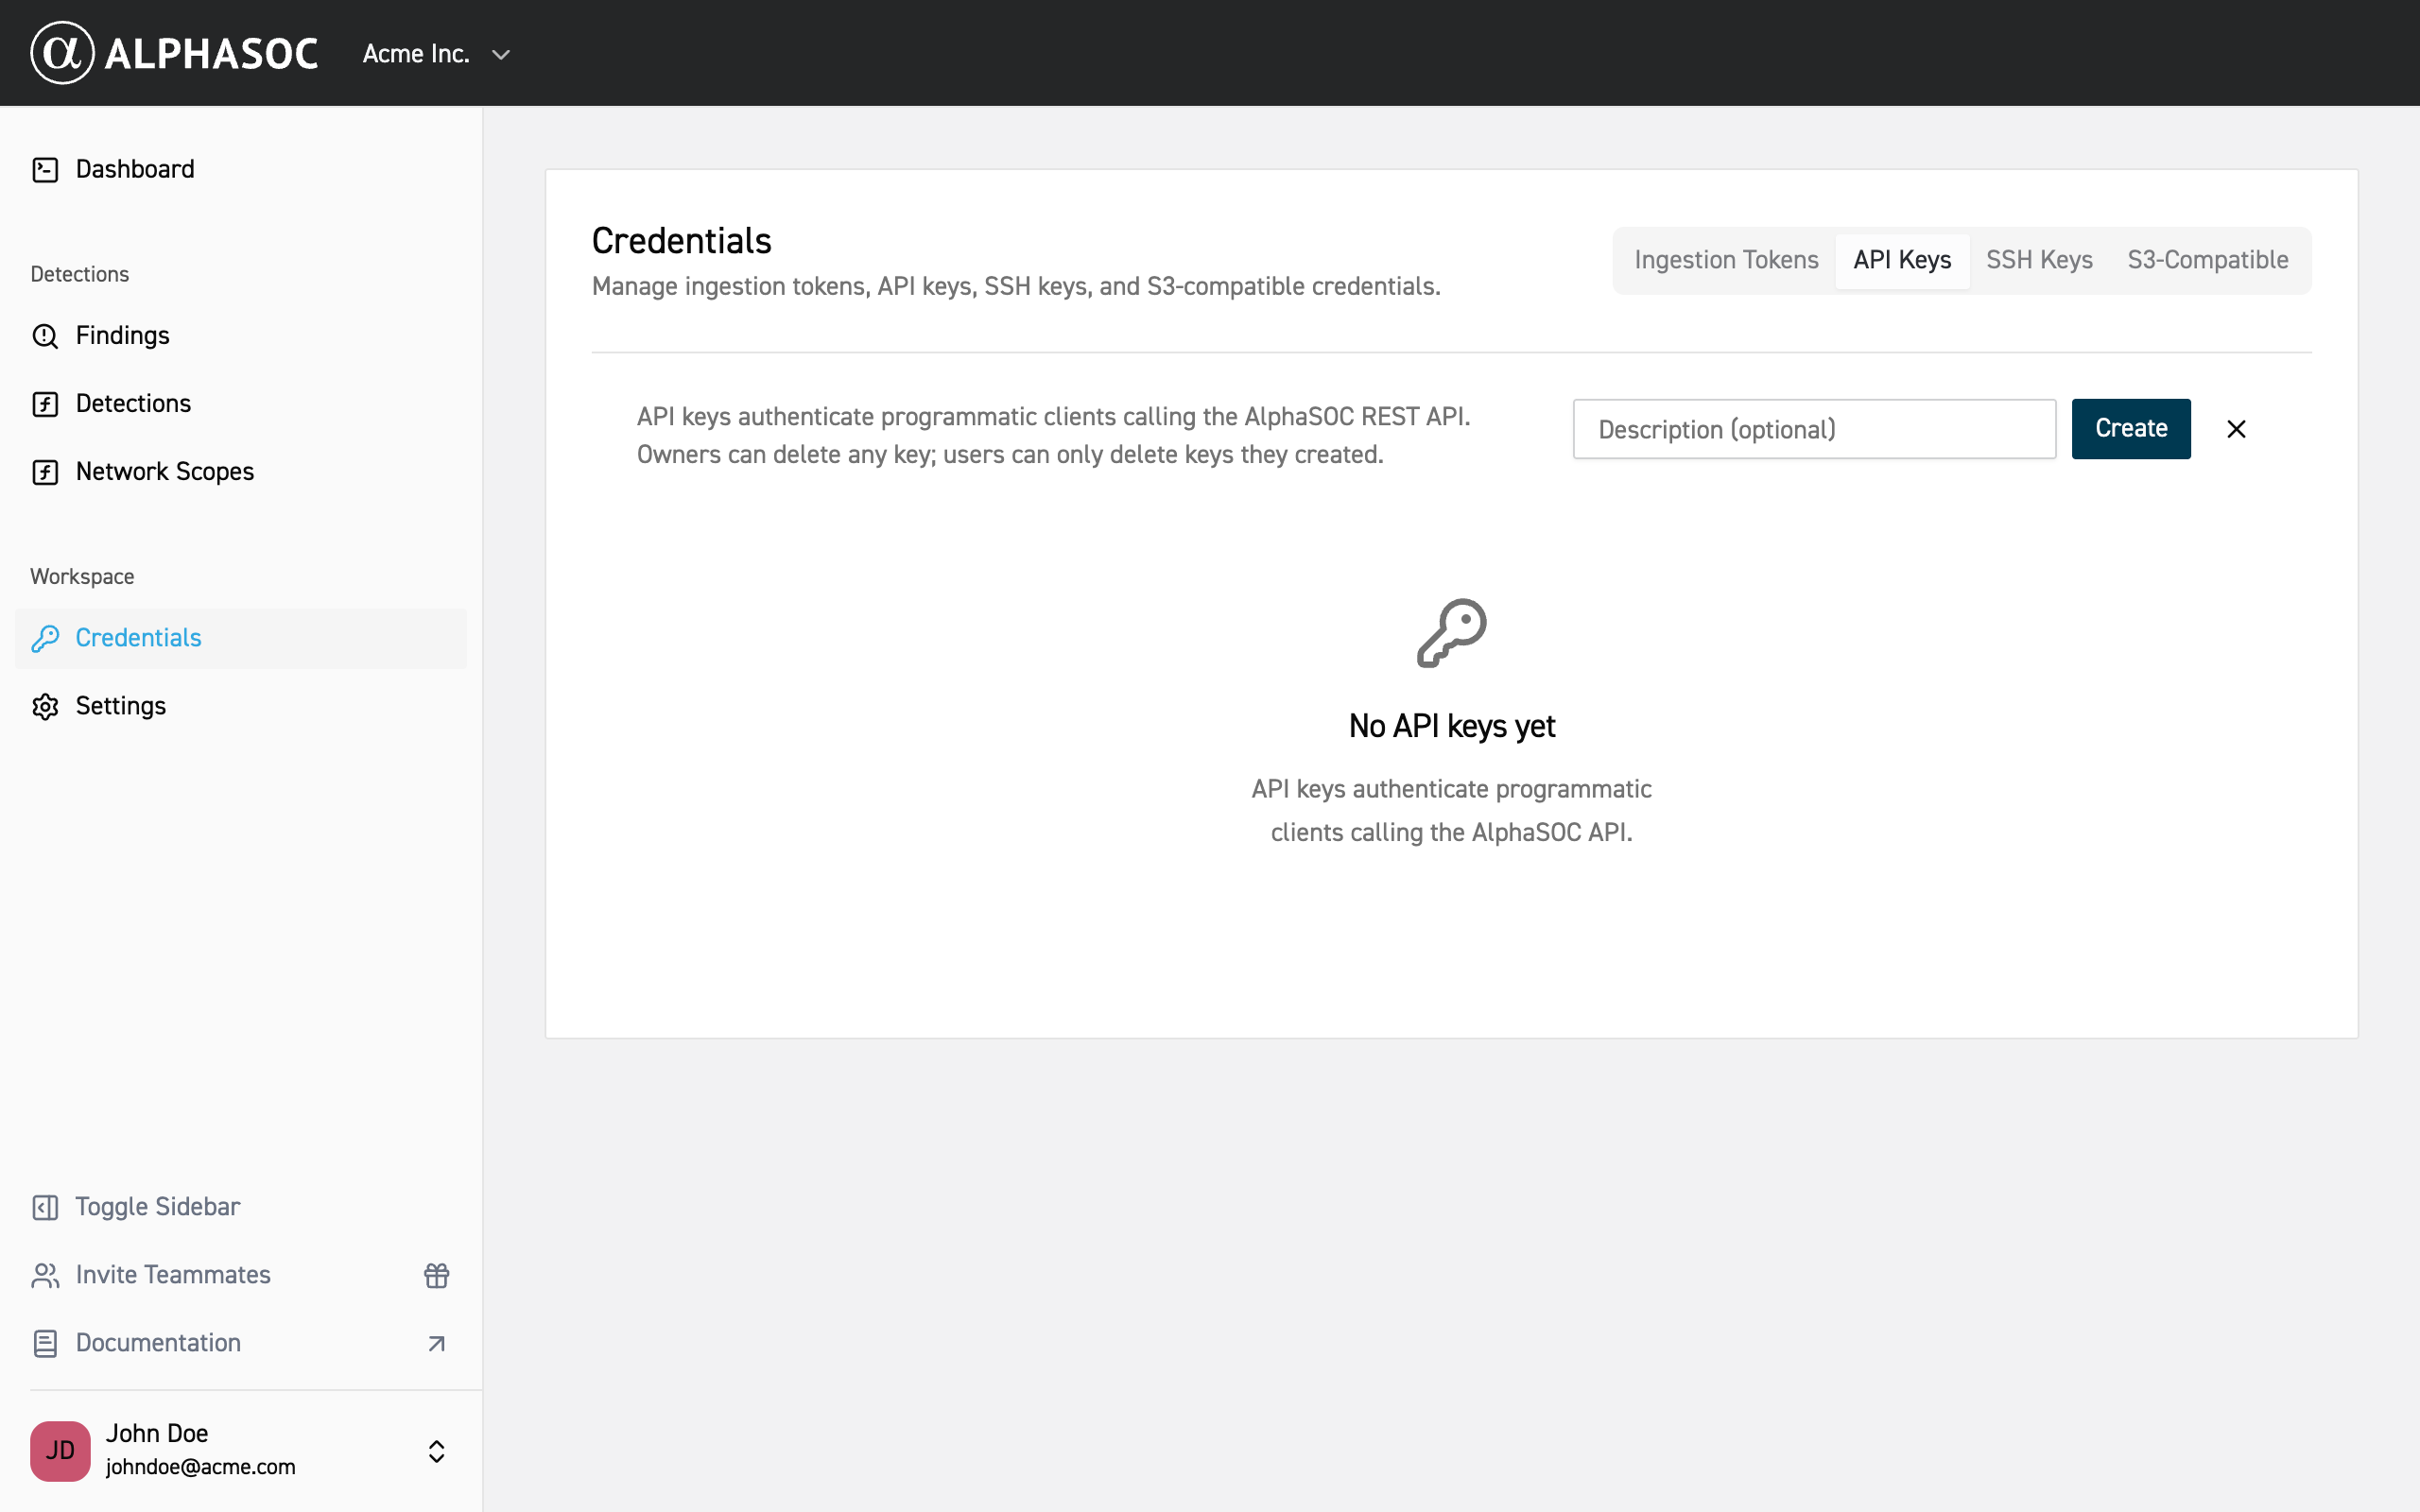
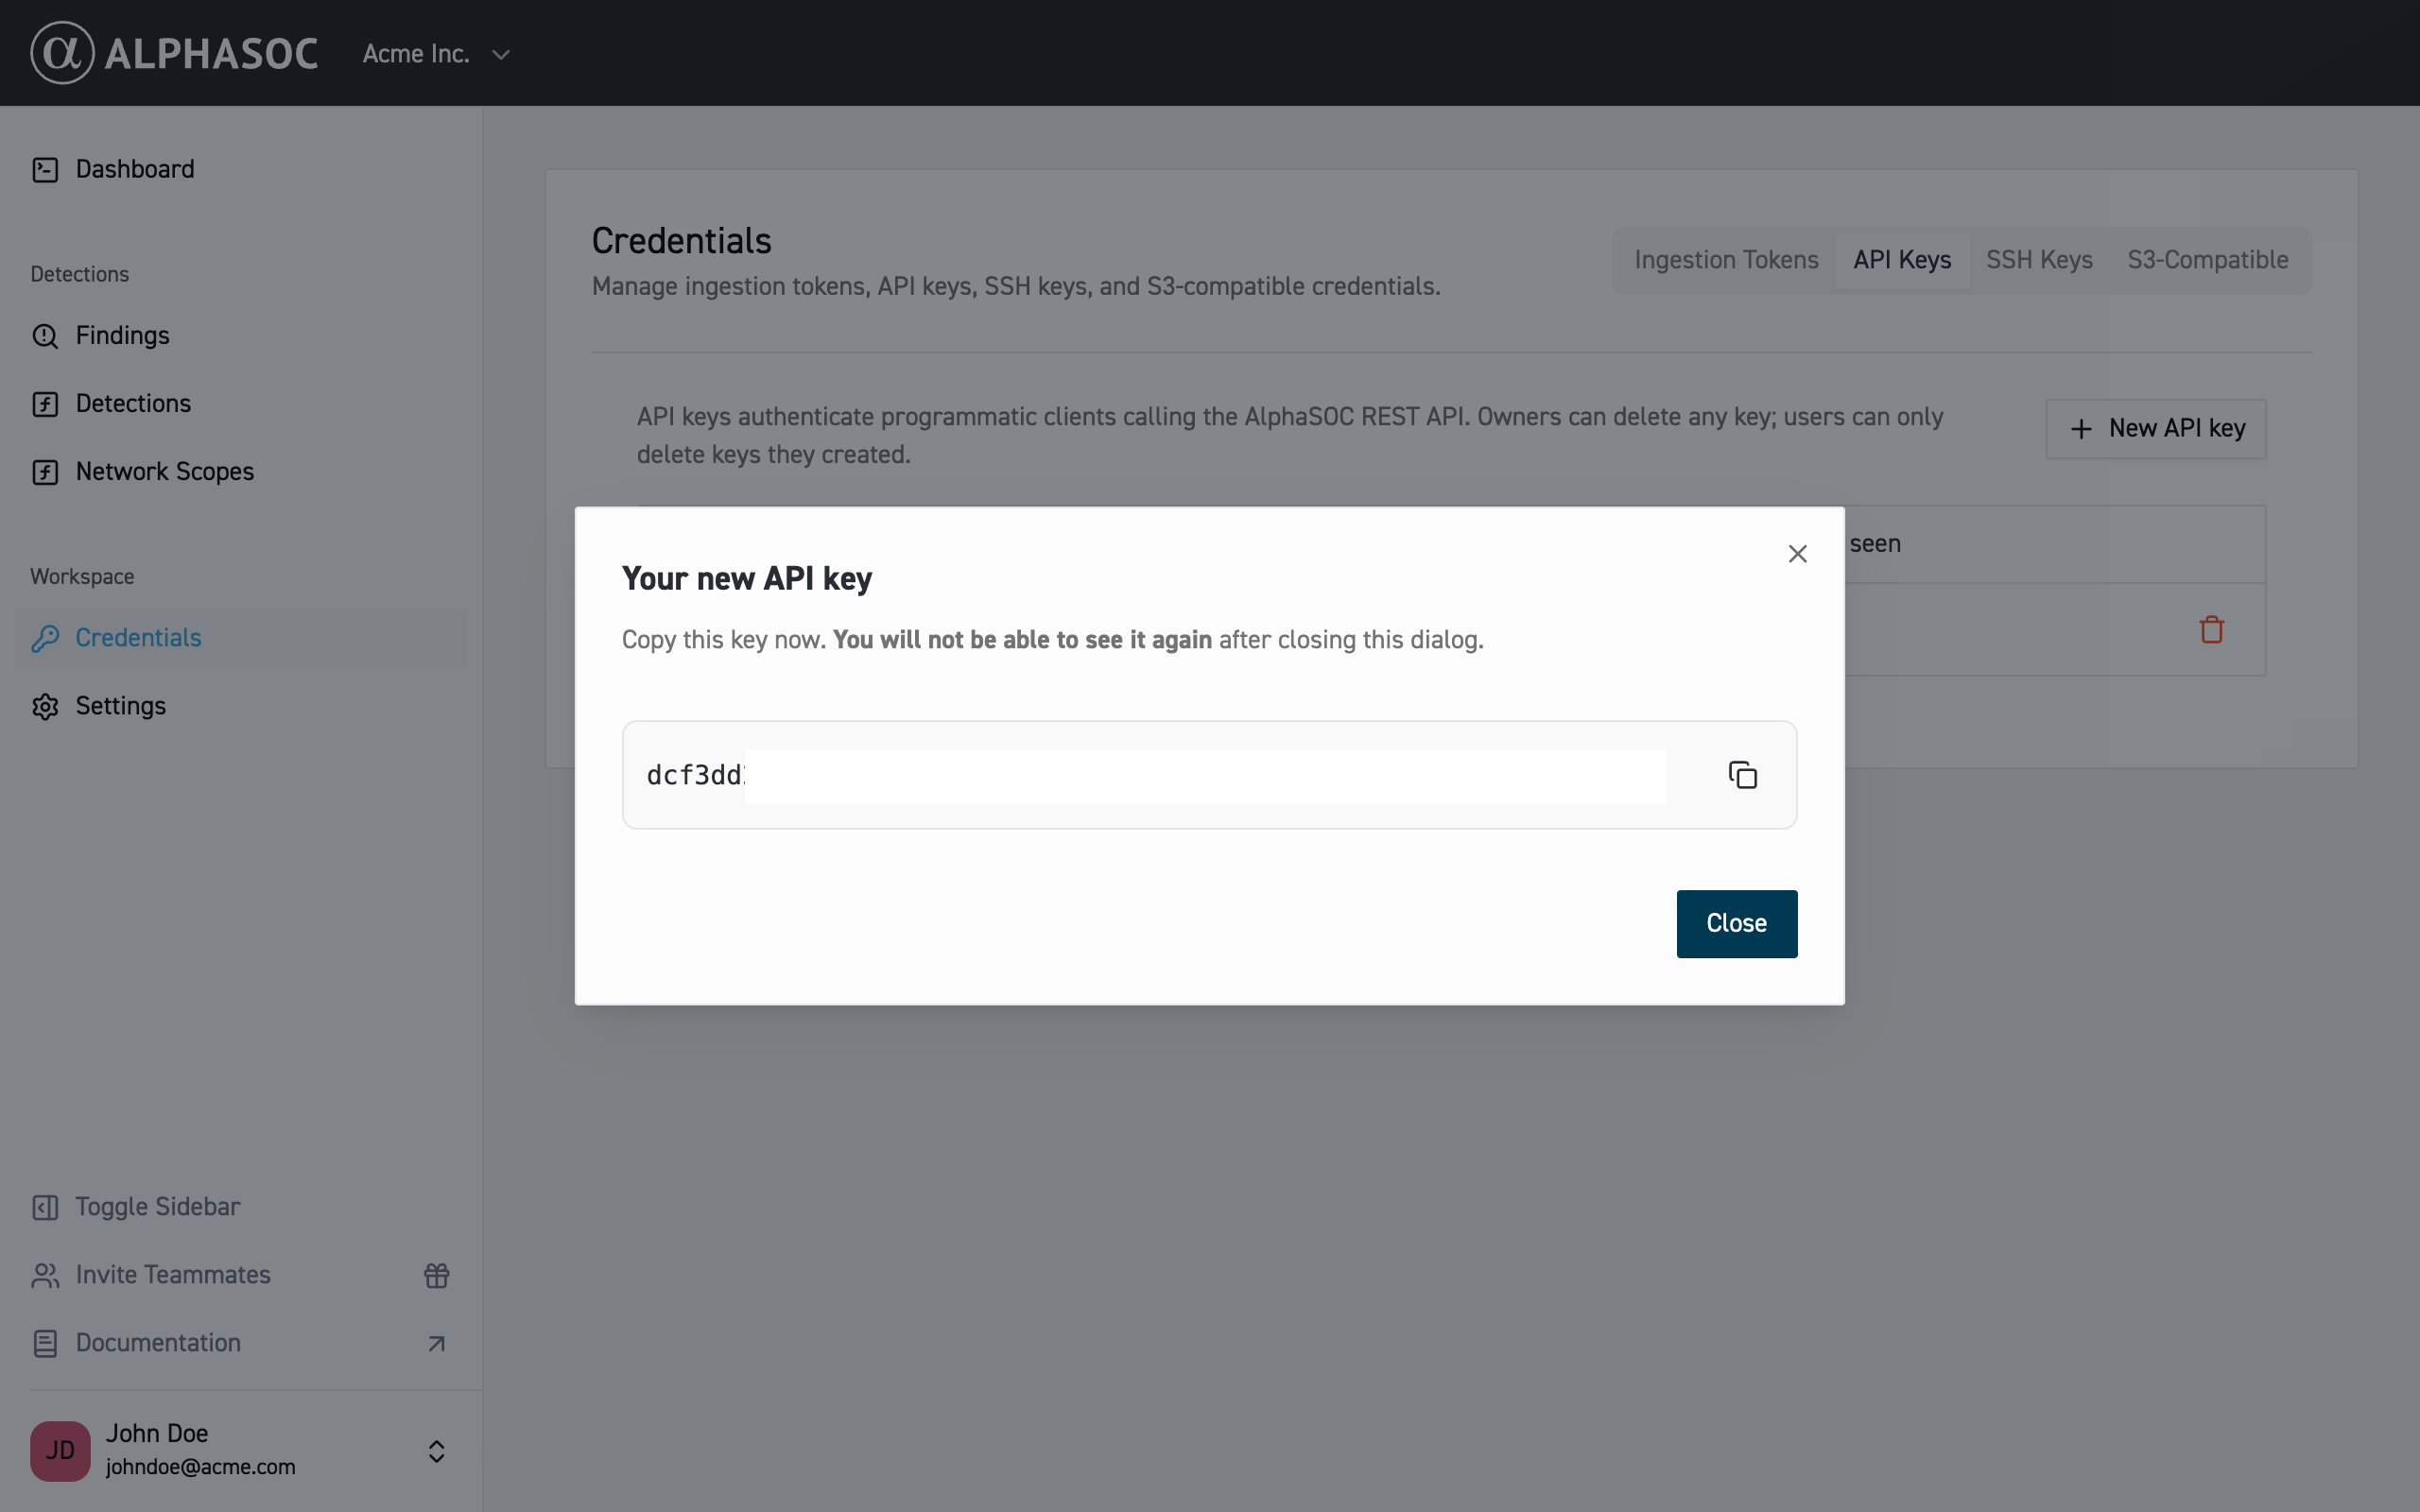
- Click Create to create the API key.
- Copy the generated API key and keep it in a secure place, as you will need it
to configure the integration with Splunk.
- In the AlphaSOC for Splunk app, go to the Settings tab.
- Click on the Analytics Engine. Paste your AlphaSOC API URL under API
URL and the copied API key into the designated field under API Key.
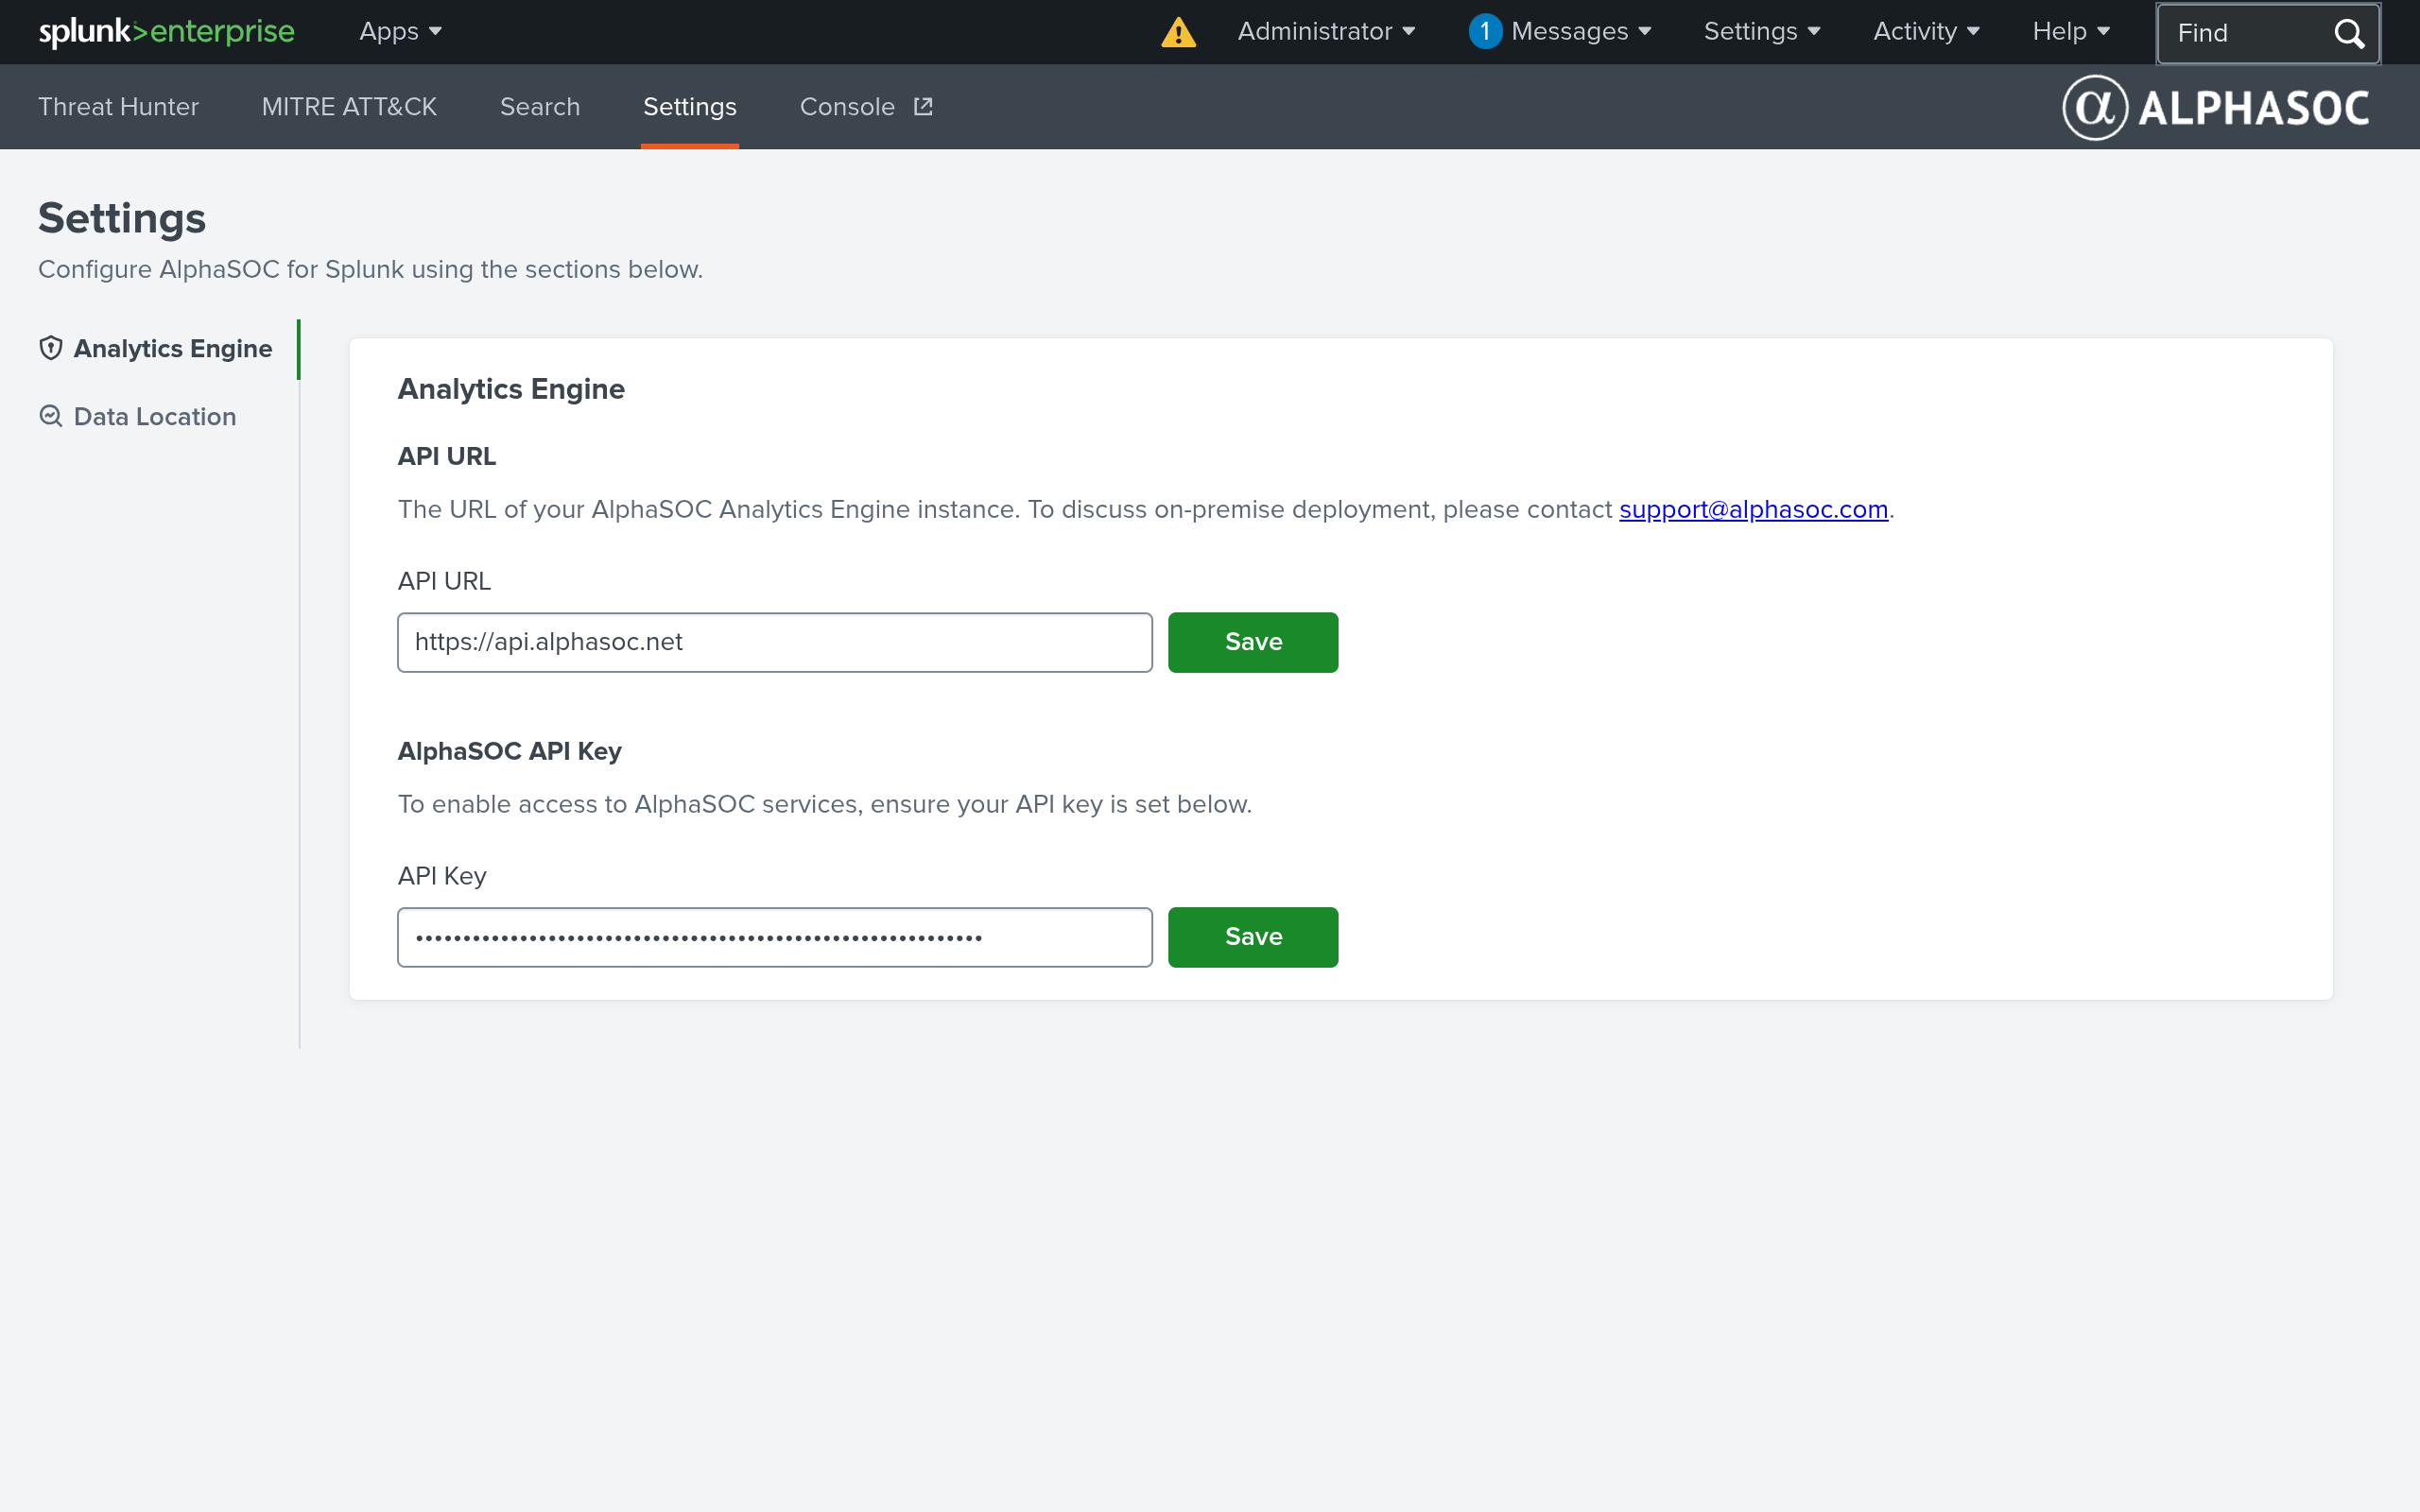
- Click Save to apply the changes.
- Still in the Settings tab, click on Data Location. Select the Splunk
index containing your AlphaSOC findings from the dropdown (e.g.,
alphasoc_findings).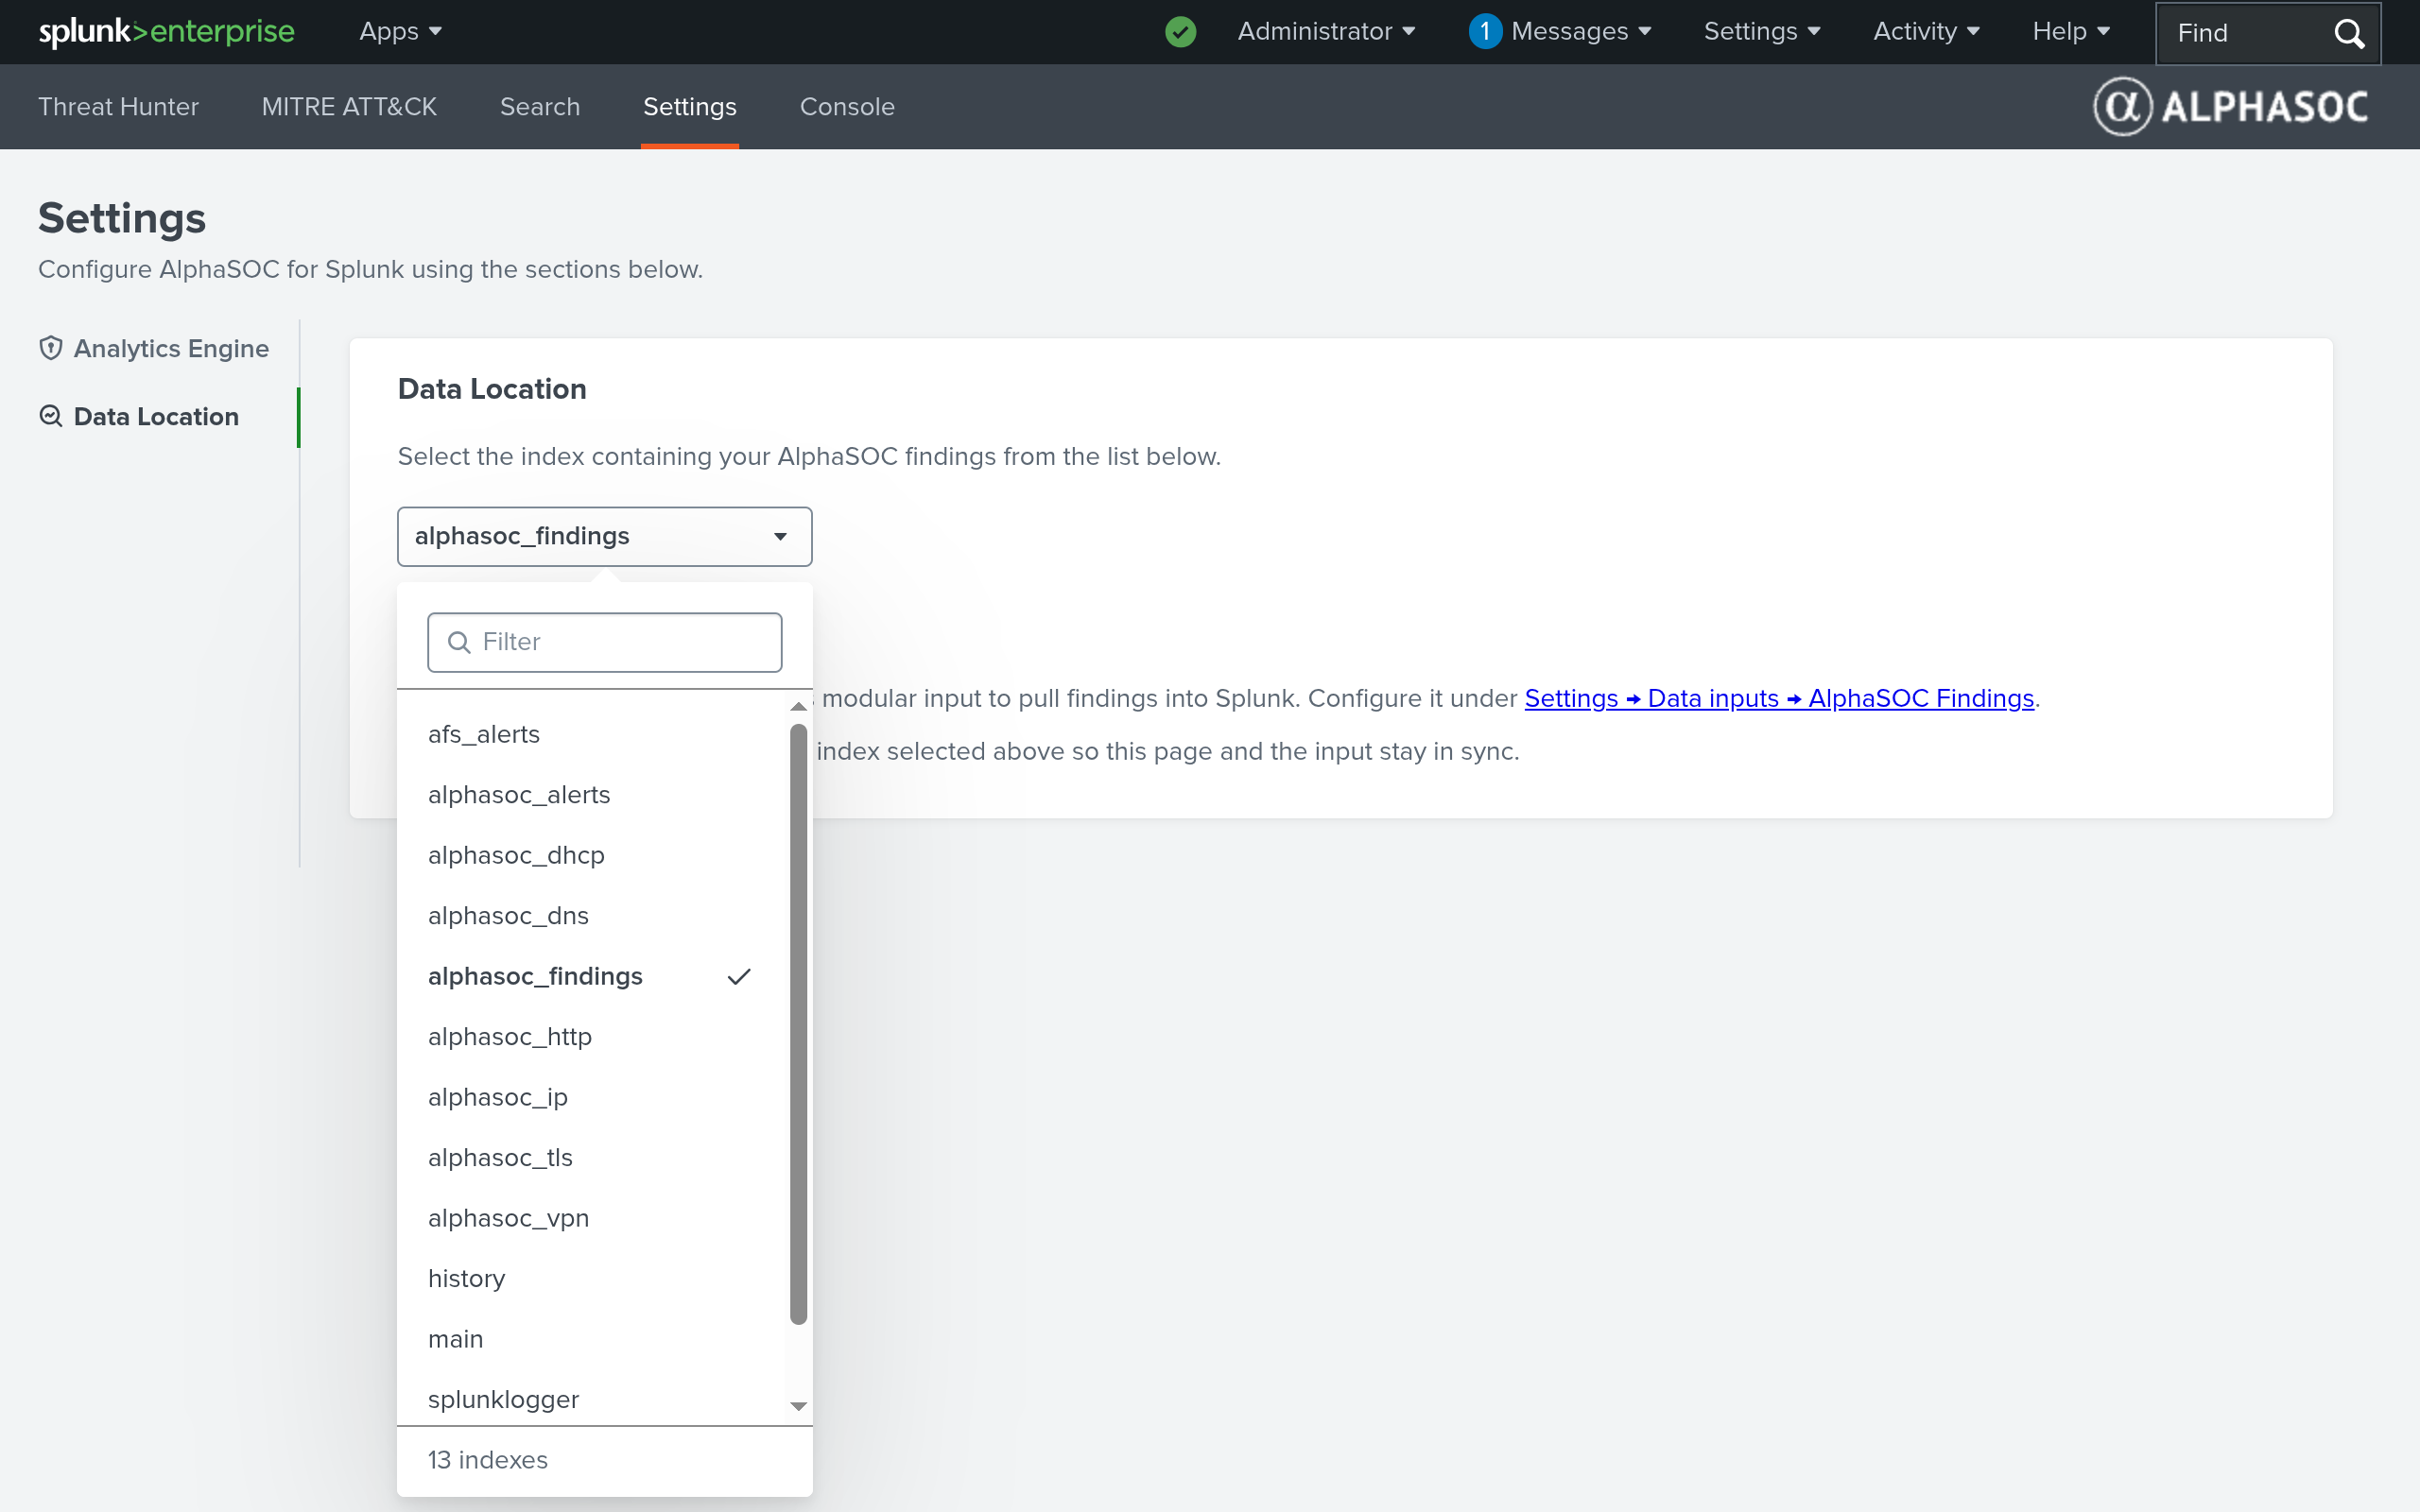
Investigating Threats
The AlphaSOC for Splunk app provides three views that form an investigation workflow — from high-level threat overview down to raw OCSF findings.
Threat hunter
The Threat Hunter dashboard is the default landing page. It displays a prioritized table of all entities with active detections in your environment.
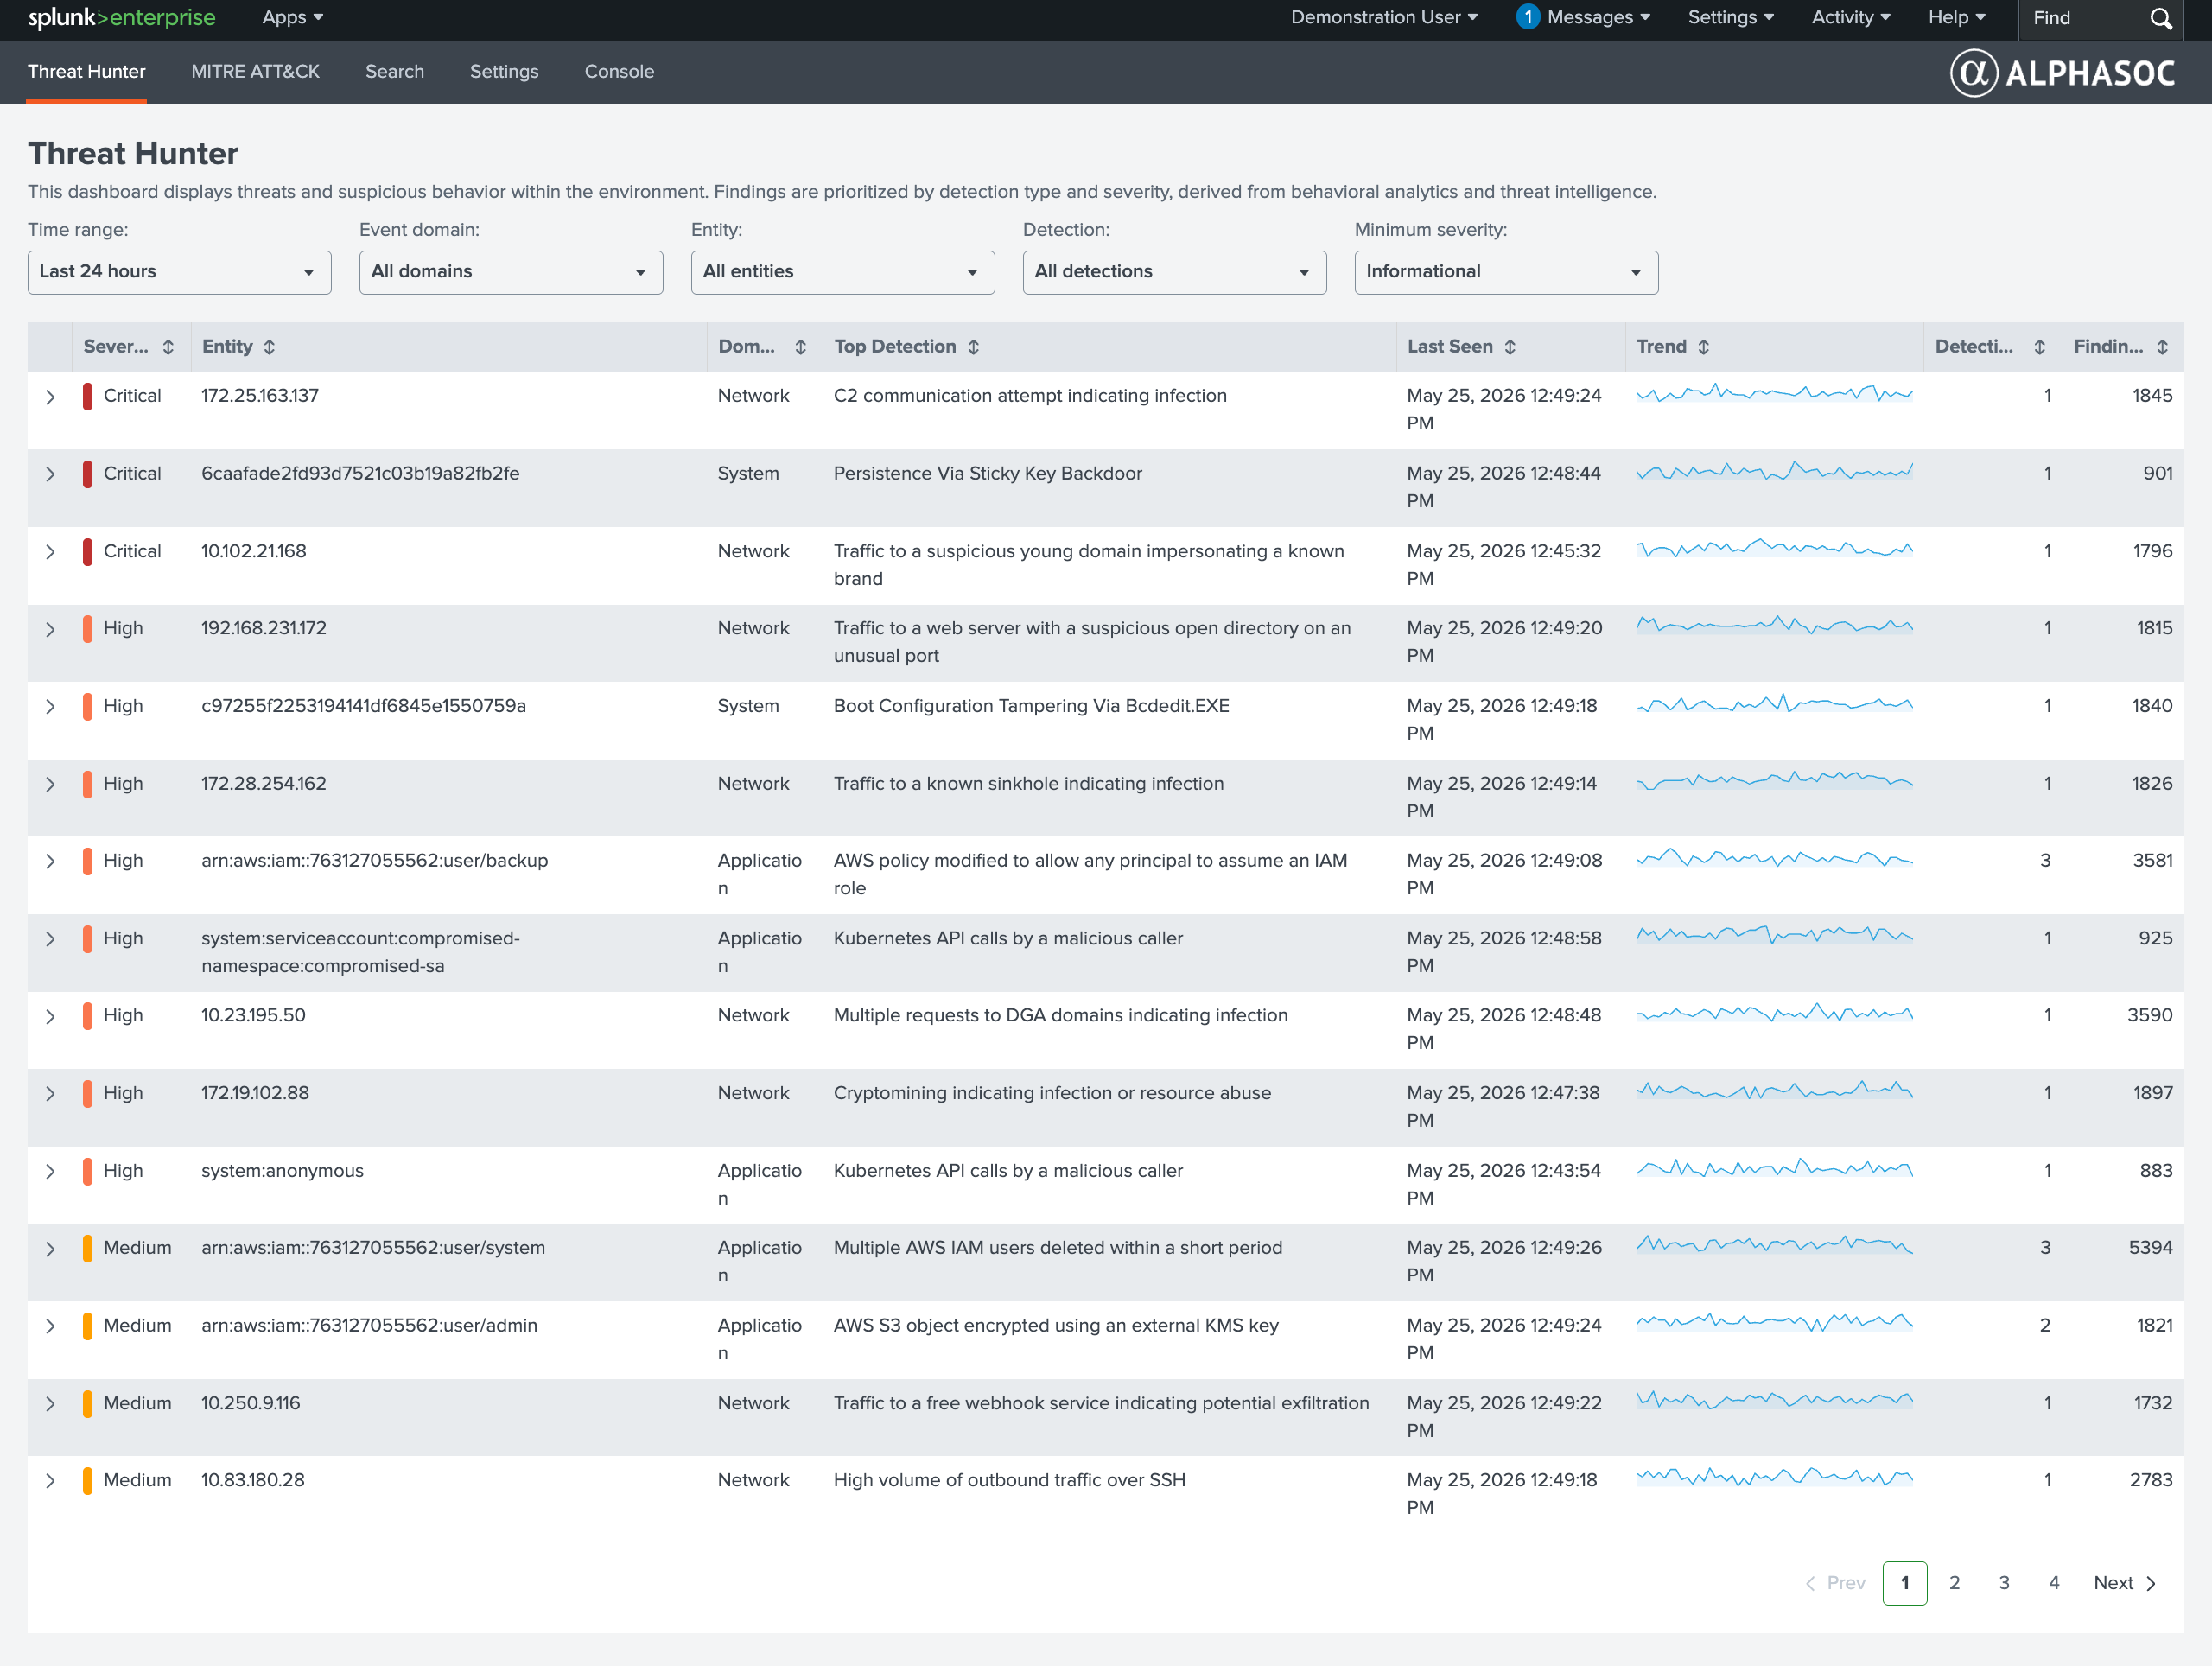
Each row represents an entity (IP address, hostname, AWS ARN, Kubernetes service account, etc.) and includes:
- Severity — highest severity level assigned to the entity's findings.
- Entity — the identifier of the affected host or account.
- Domain — event domain: Network, System, or Application.
- Top Detection — the name of the highest-priority detection for this entity.
- Last Seen — timestamp of the most recent finding.
- Trend — sparkline showing finding volume over the selected time range.
- Detections — number of distinct detection rules that fired.
- Findings — total count of findings associated with the entity.
Use the filter bar at the top to narrow results by time range, event domain, entity, detection type, and minimum severity. Rows are color-coded by severity — Critical, High, Medium — so the most urgent items stand out at a glance.
MITRE ATT&CK
The MITRE ATT&CK dashboard maps the same findings onto the MITRE ATT&CK Matrix for Enterprise. Columns represent tactics, and each cell lists the techniques AlphaSOC has observed in your environment.
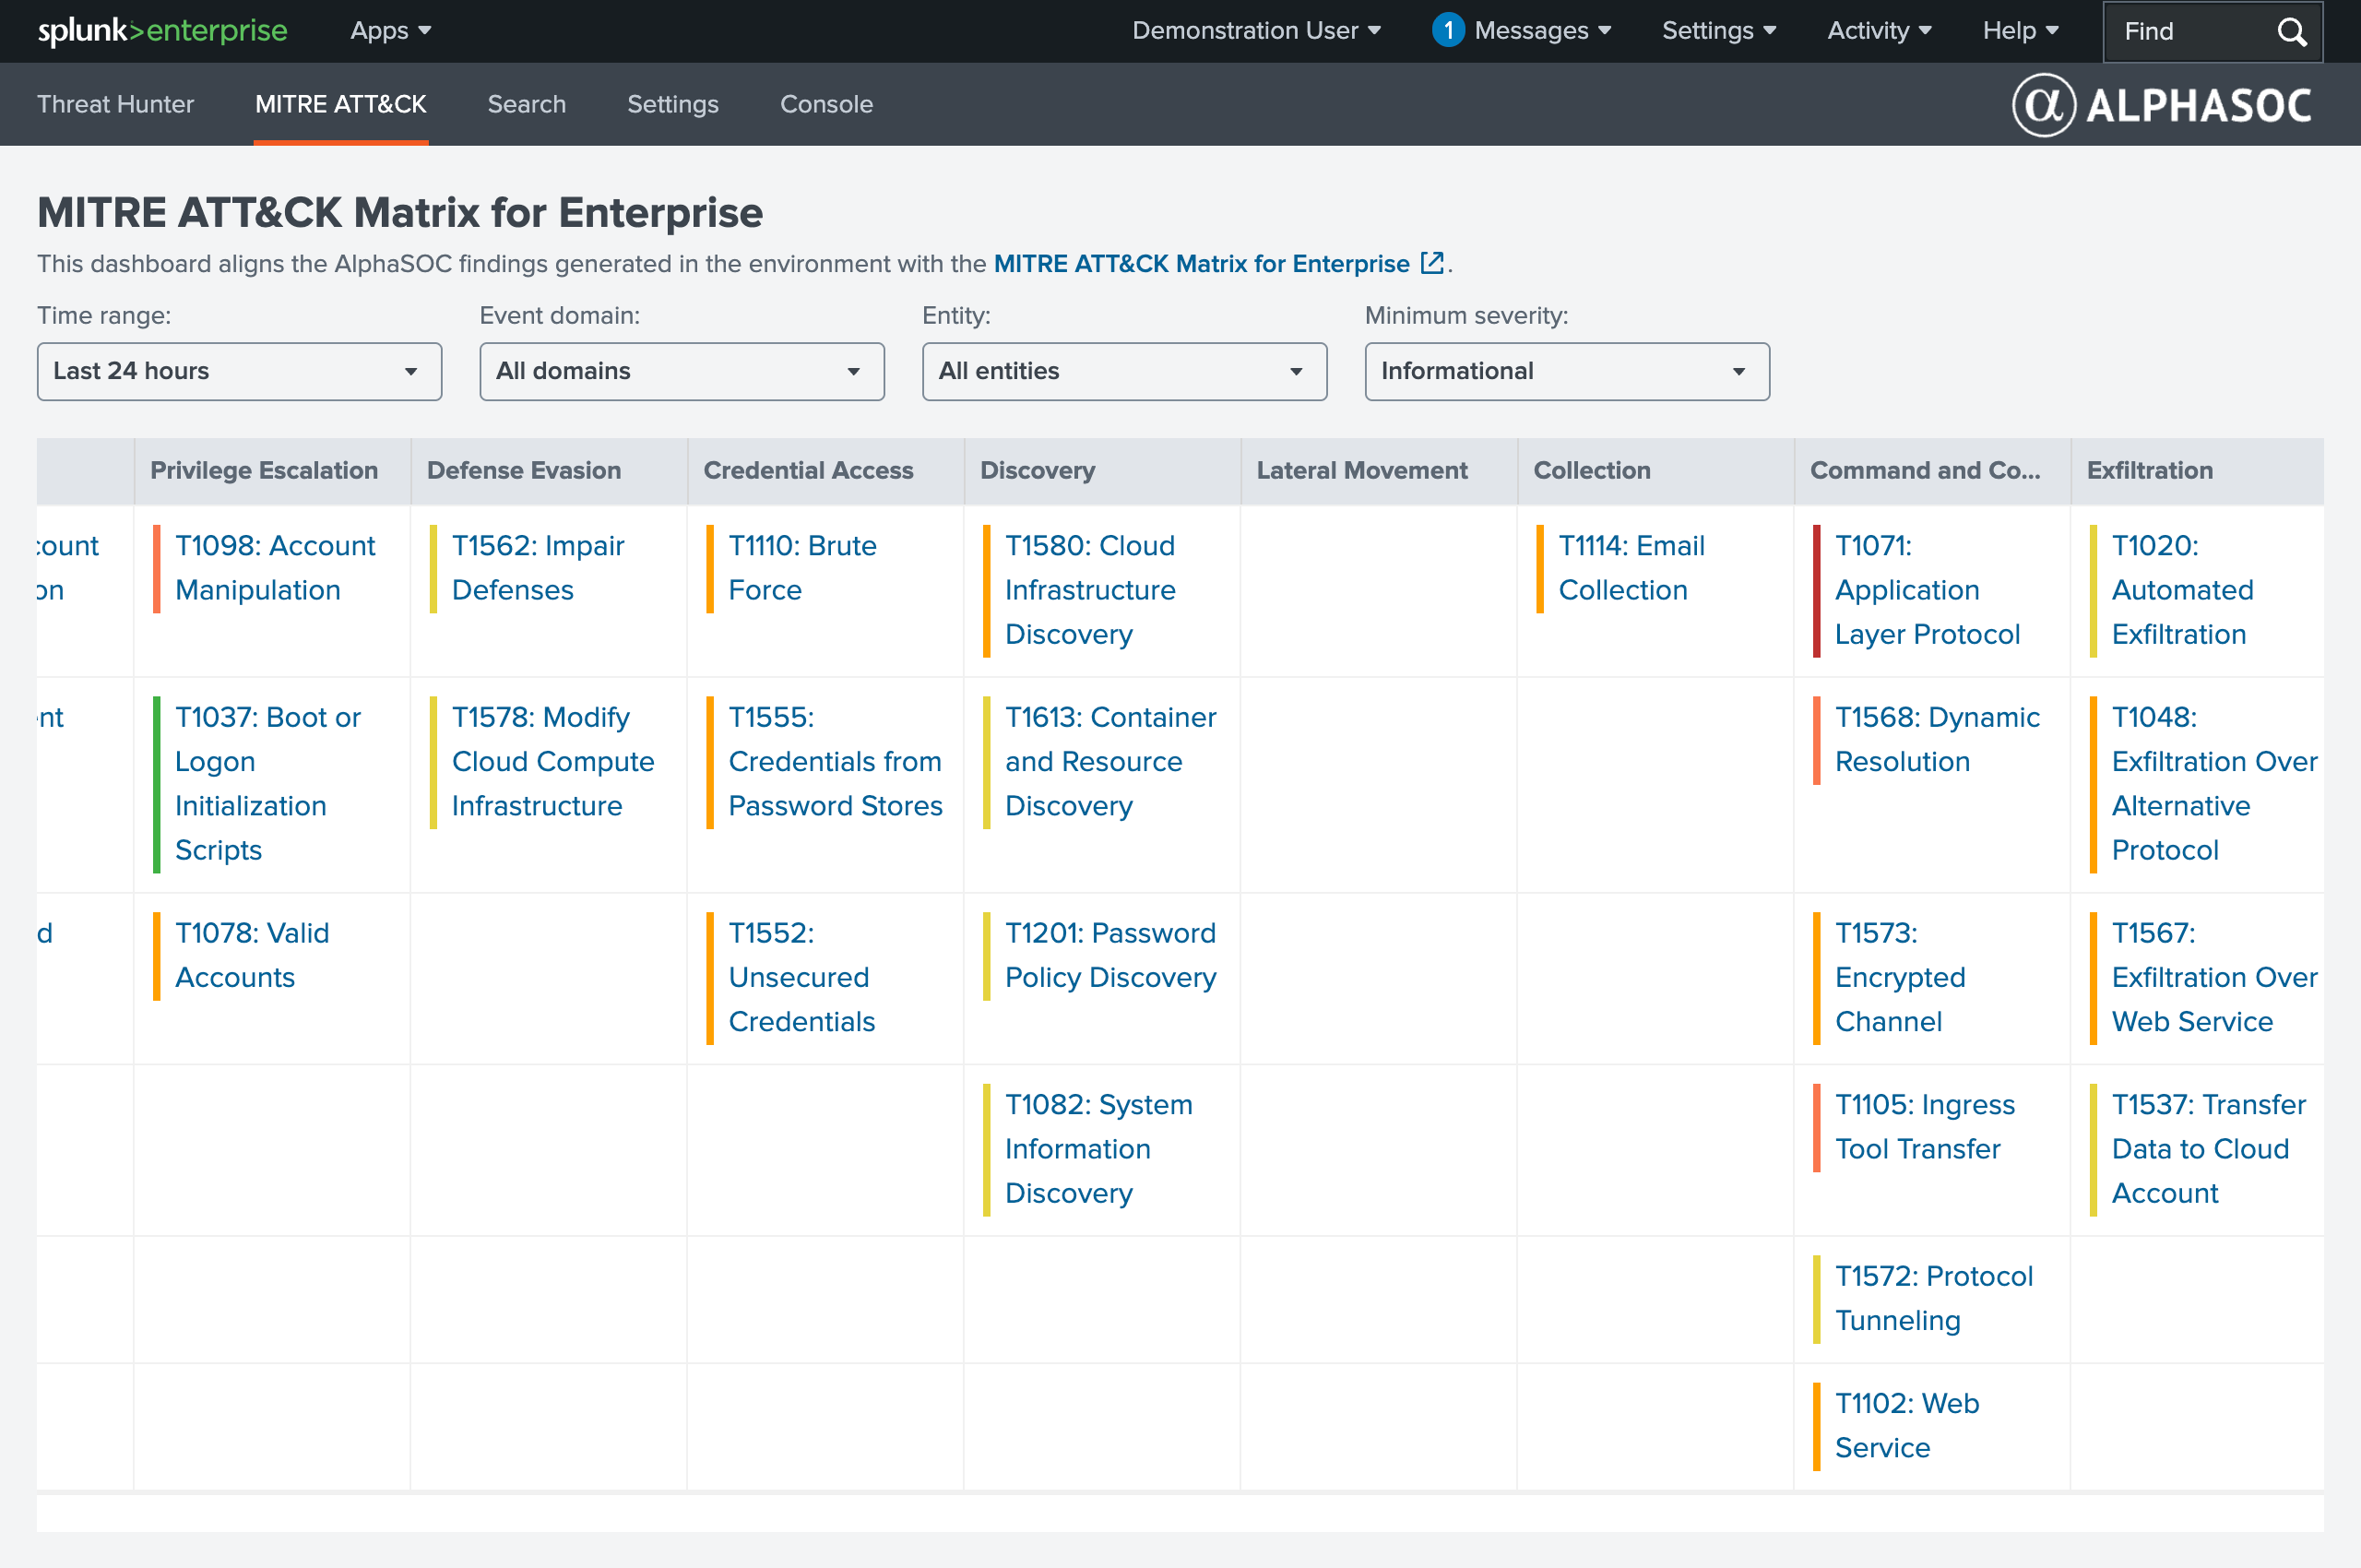
Use this view to assess attacker coverage across the kill chain rather than triaging individual entities.
Findings explorer
From the Threat Hunter table, click on any entity row to open the Findings Explorer. This is the investigation dashboard for a single entity.
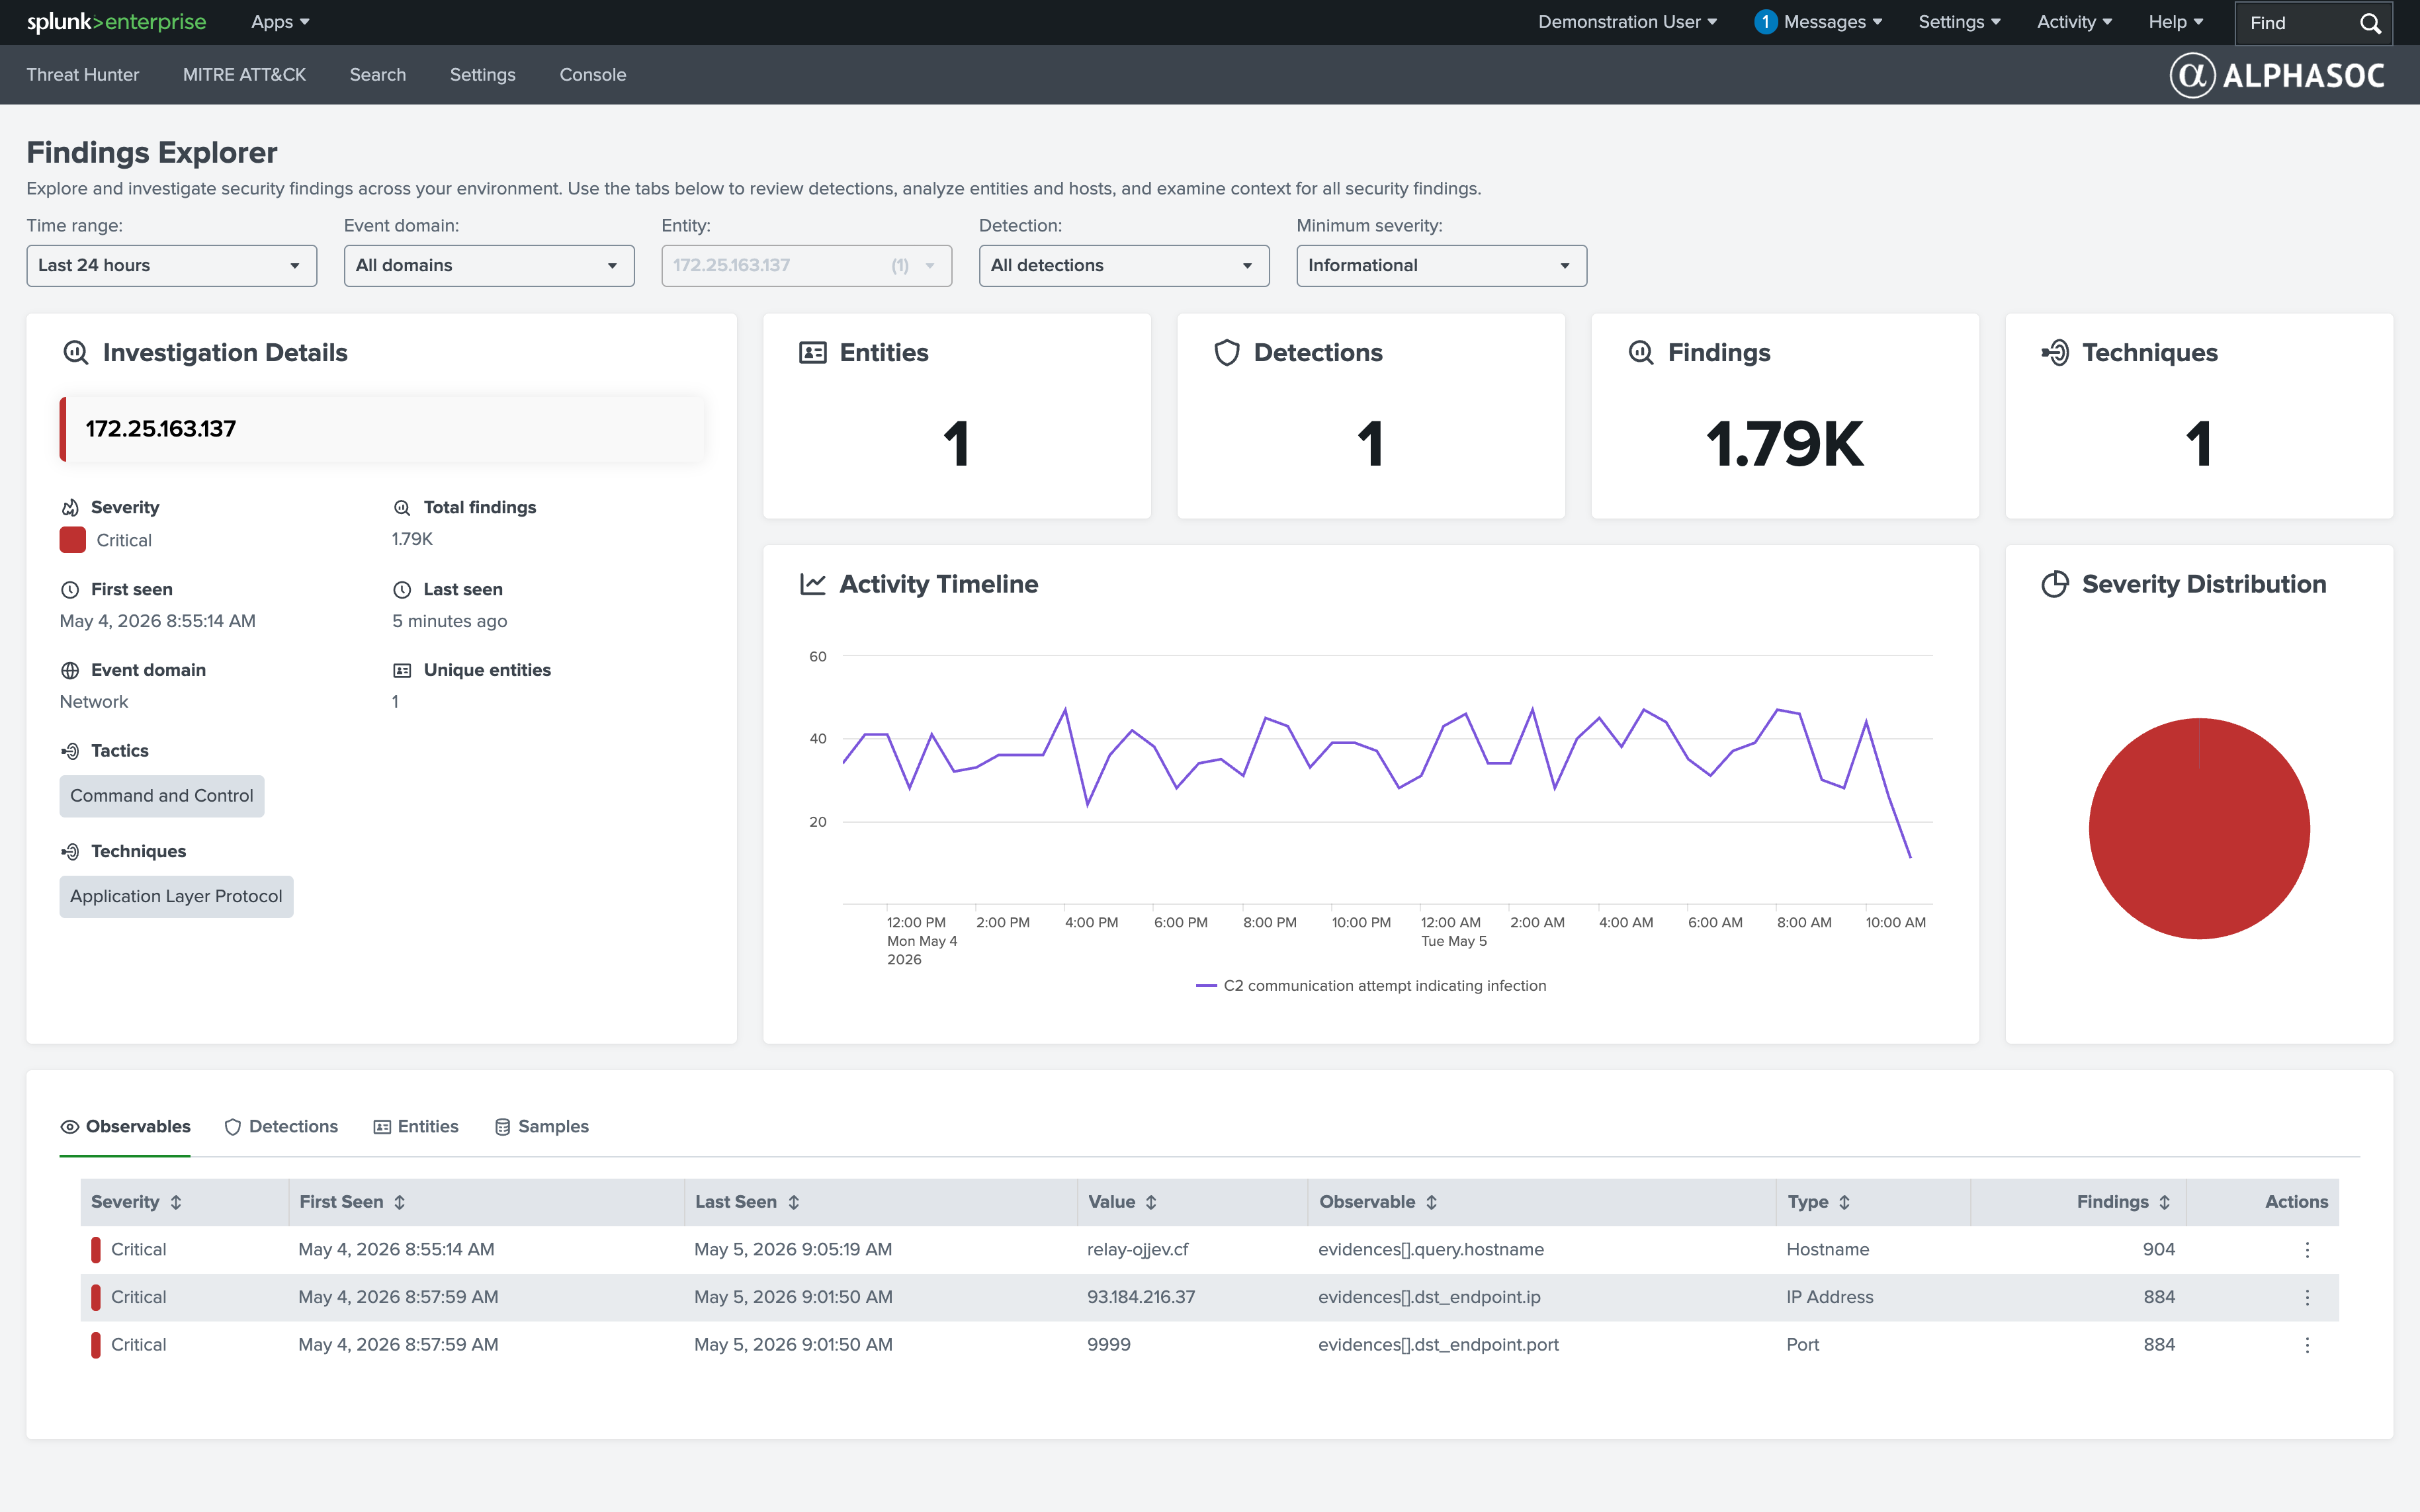
Investigation details
The left panel summarizes the entity under investigation:
- Entity identifier — the IP address, hostname, or account (e.g.,
172.25.163.137). - Severity — the highest severity across all findings for this entity.
- Total findings — aggregate count of findings.
- First seen / Last seen — the time window over which activity was observed.
- Event domain — Network, System, or Application.
- Unique entities — count of distinct entities involved.
- Tactics and Techniques — MITRE ATT&CK tactics and techniques mapped to the entity's findings.
Summary cards
Four cards across the top provide at-a-glance counts: Entities, Detections, Findings, and Techniques. Use these to gauge the scope of the investigation — how many detection rules fired, how many total findings were generated, and how many ATT&CK techniques are in play.
Activity timeline
The timeline chart plots finding volume over the selected time range. Use it to identify spikes, sustained activity, or beaconing patterns. The legend indicates the detection type (e.g., "C2 communication attempt indicating infection").
Severity distribution
The donut chart breaks down findings by severity level. A chart dominated by Critical indicates an entity that needs immediate attention.
Observables, detections, entities, and samples
The tabbed section at the bottom provides the detailed breakdown:
- Observables — lists every observable associated with the entity's findings: queried hostnames, destination IPs, destination ports. Each row shows severity, first/last seen timestamps, the observable value, its type (Hostname, IP Address, Port), and the number of findings it appears in.
- Detections — groups findings by detection name.
- Entities — lists all entities involved.
- Samples — shows detailed information about the findings.
Pivoting to raw findings
Each observable row includes an Actions menu (three-dot icon). Click it to open the raw OCSF findings in Splunk Search.
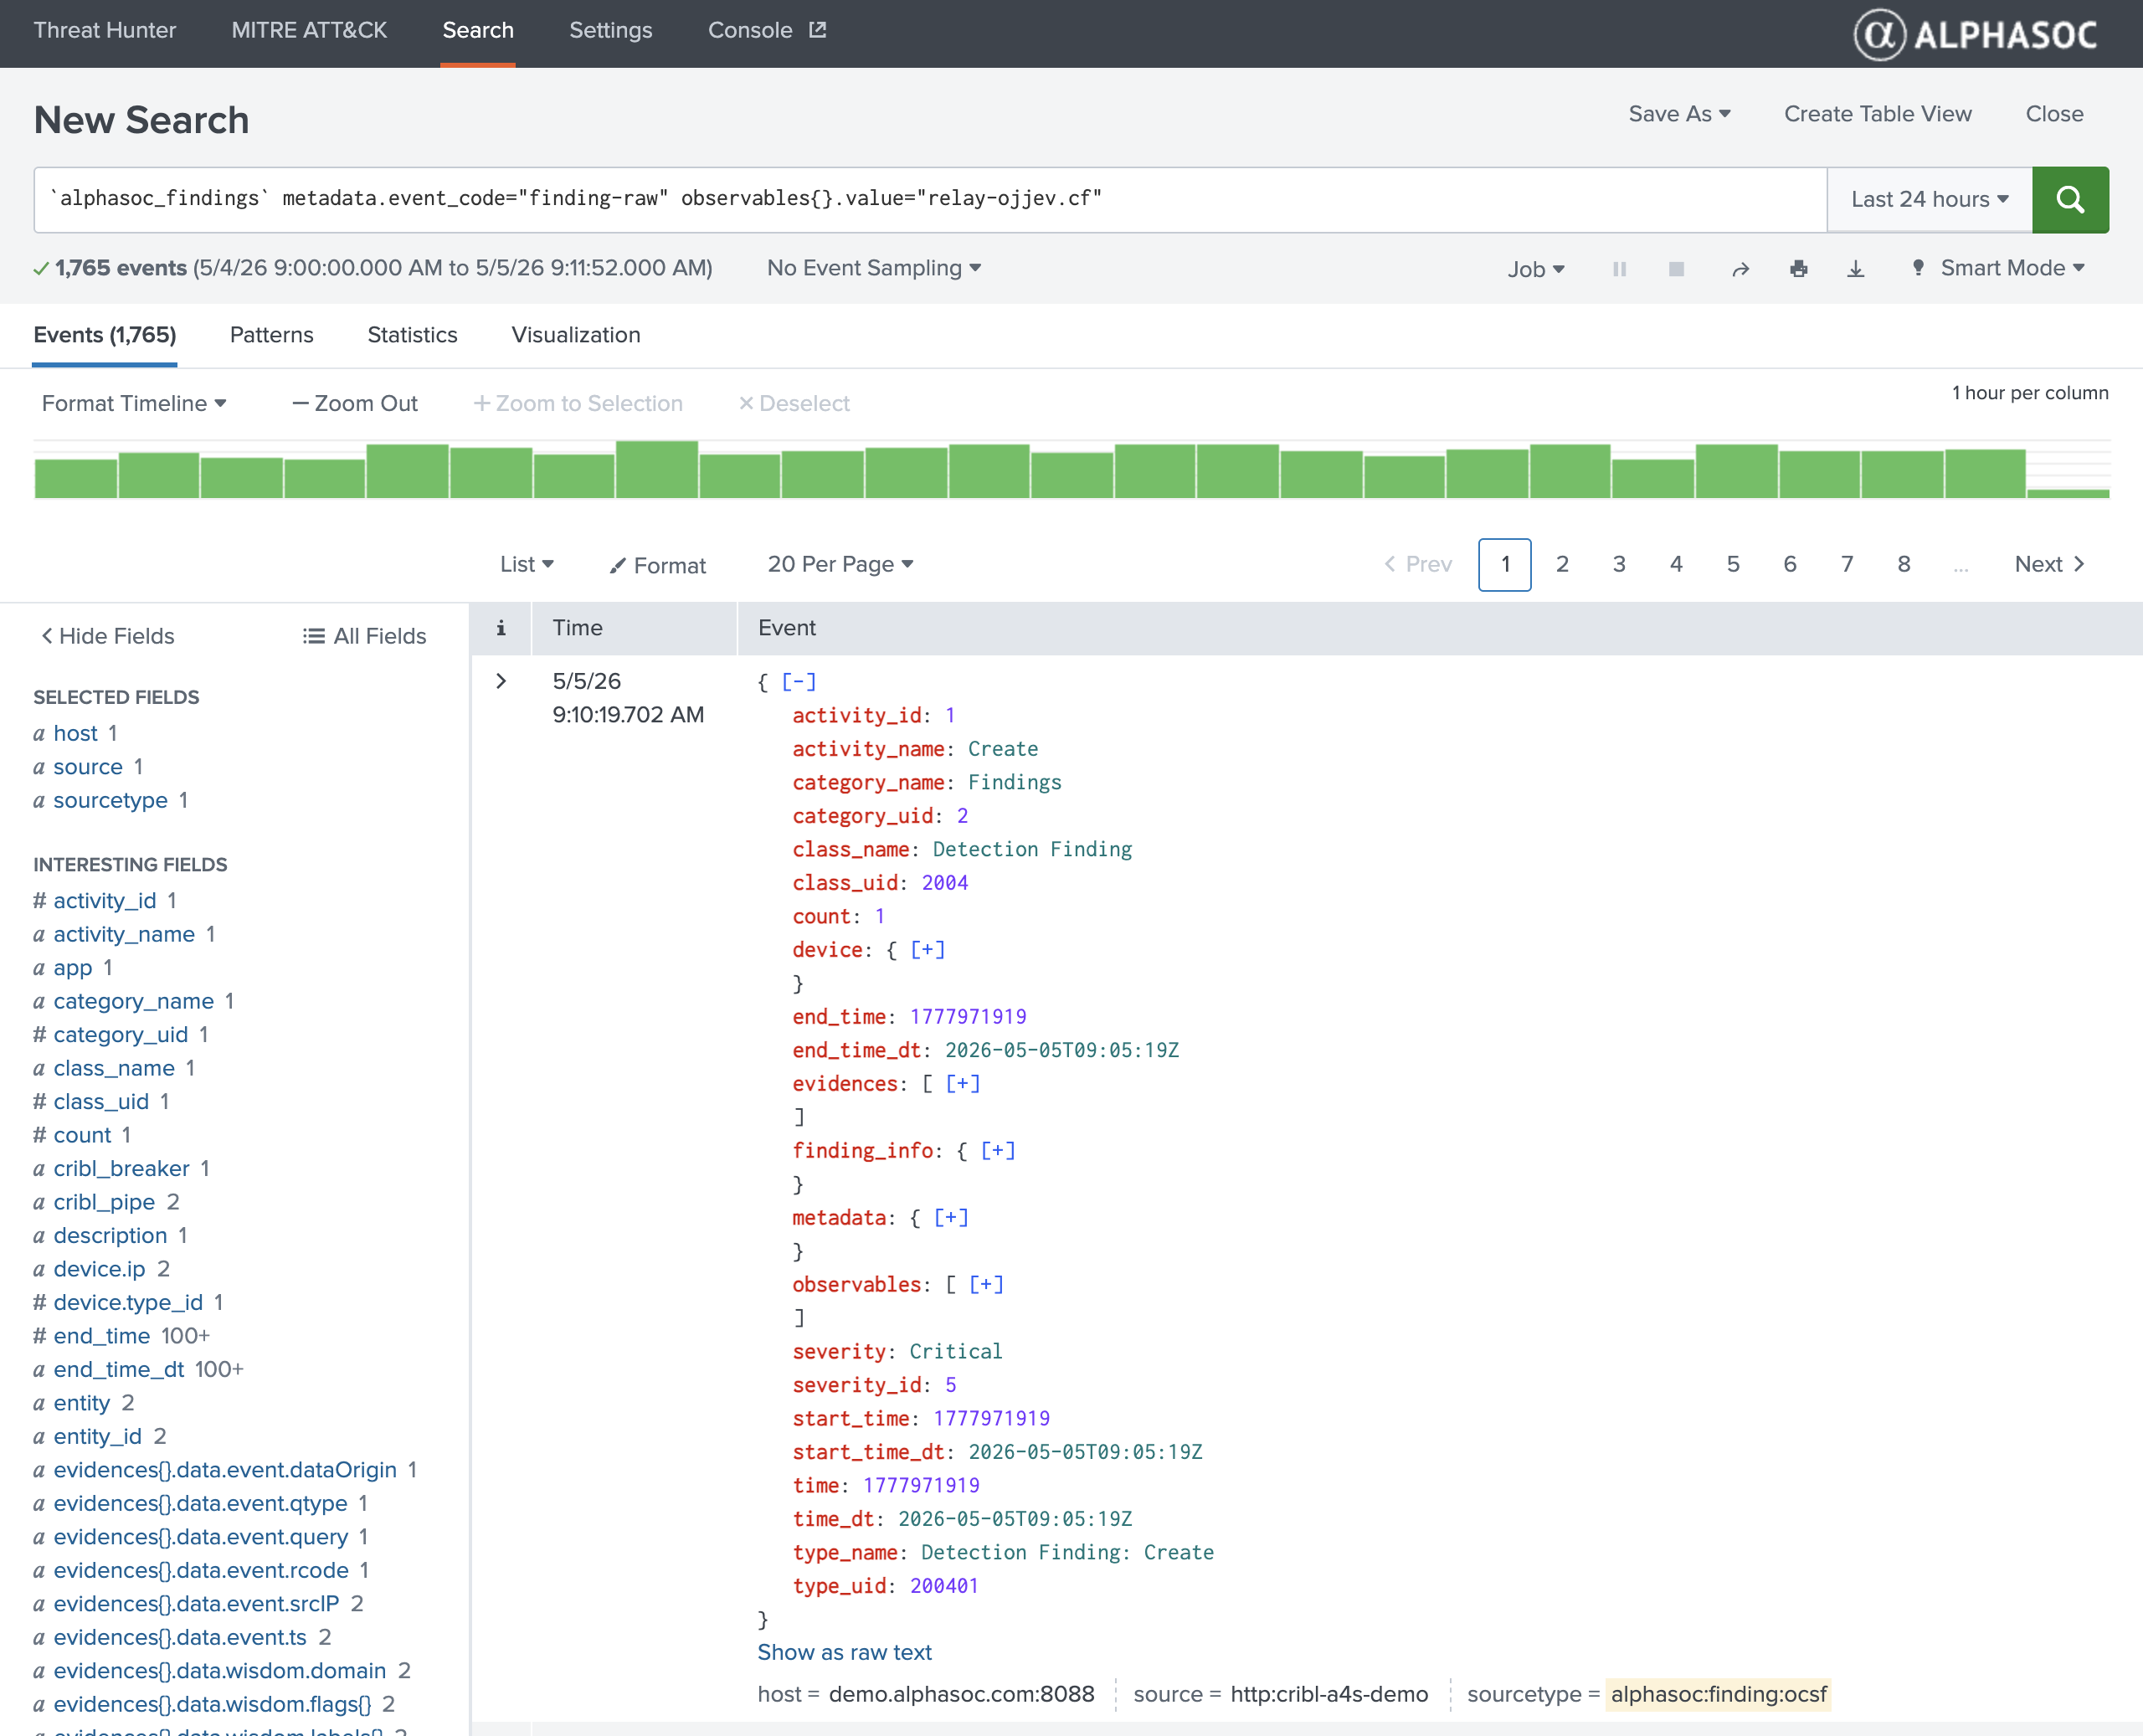
This opens a pre-populated search that retrieves the AlphaSOC OCSF findings matching that observable. Each event in the results includes:
- Event metadata — event code, timestamps, and source identifiers.
- Detection details — detection name, severity score, confidence level, and MITRE ATT&CK mapping.
- Observables — the full set of observables: queried hostnames, resolved IPs, destination endpoints, ports, and protocols.
- Evidence and context — supporting data such as DNS query types, response codes, connection metadata, and threat intelligence enrichment.
Use the Splunk field sidebar to filter, aggregate, or correlate across the dataset. From here you can build additional searches, create alerts, or export the data into your existing workflows.
AlphaSOC Data Lake Search
With the alphasoc command you can search the OCSF telemetry and threat
evidences stored in AlphaSOC's data lake, or check event volume, without leaving
Splunk Search. Use it independently from the dashboards above when you need to
query raw data by specific OCSF fields or check which sources are sending data.
alphasoc is a generating command: it must appear at the beginning of your
search pipeline, prefixed with a pipe (|), and its first argument is a
subcommand that selects what to query. The time range comes from the Splunk time
picker.
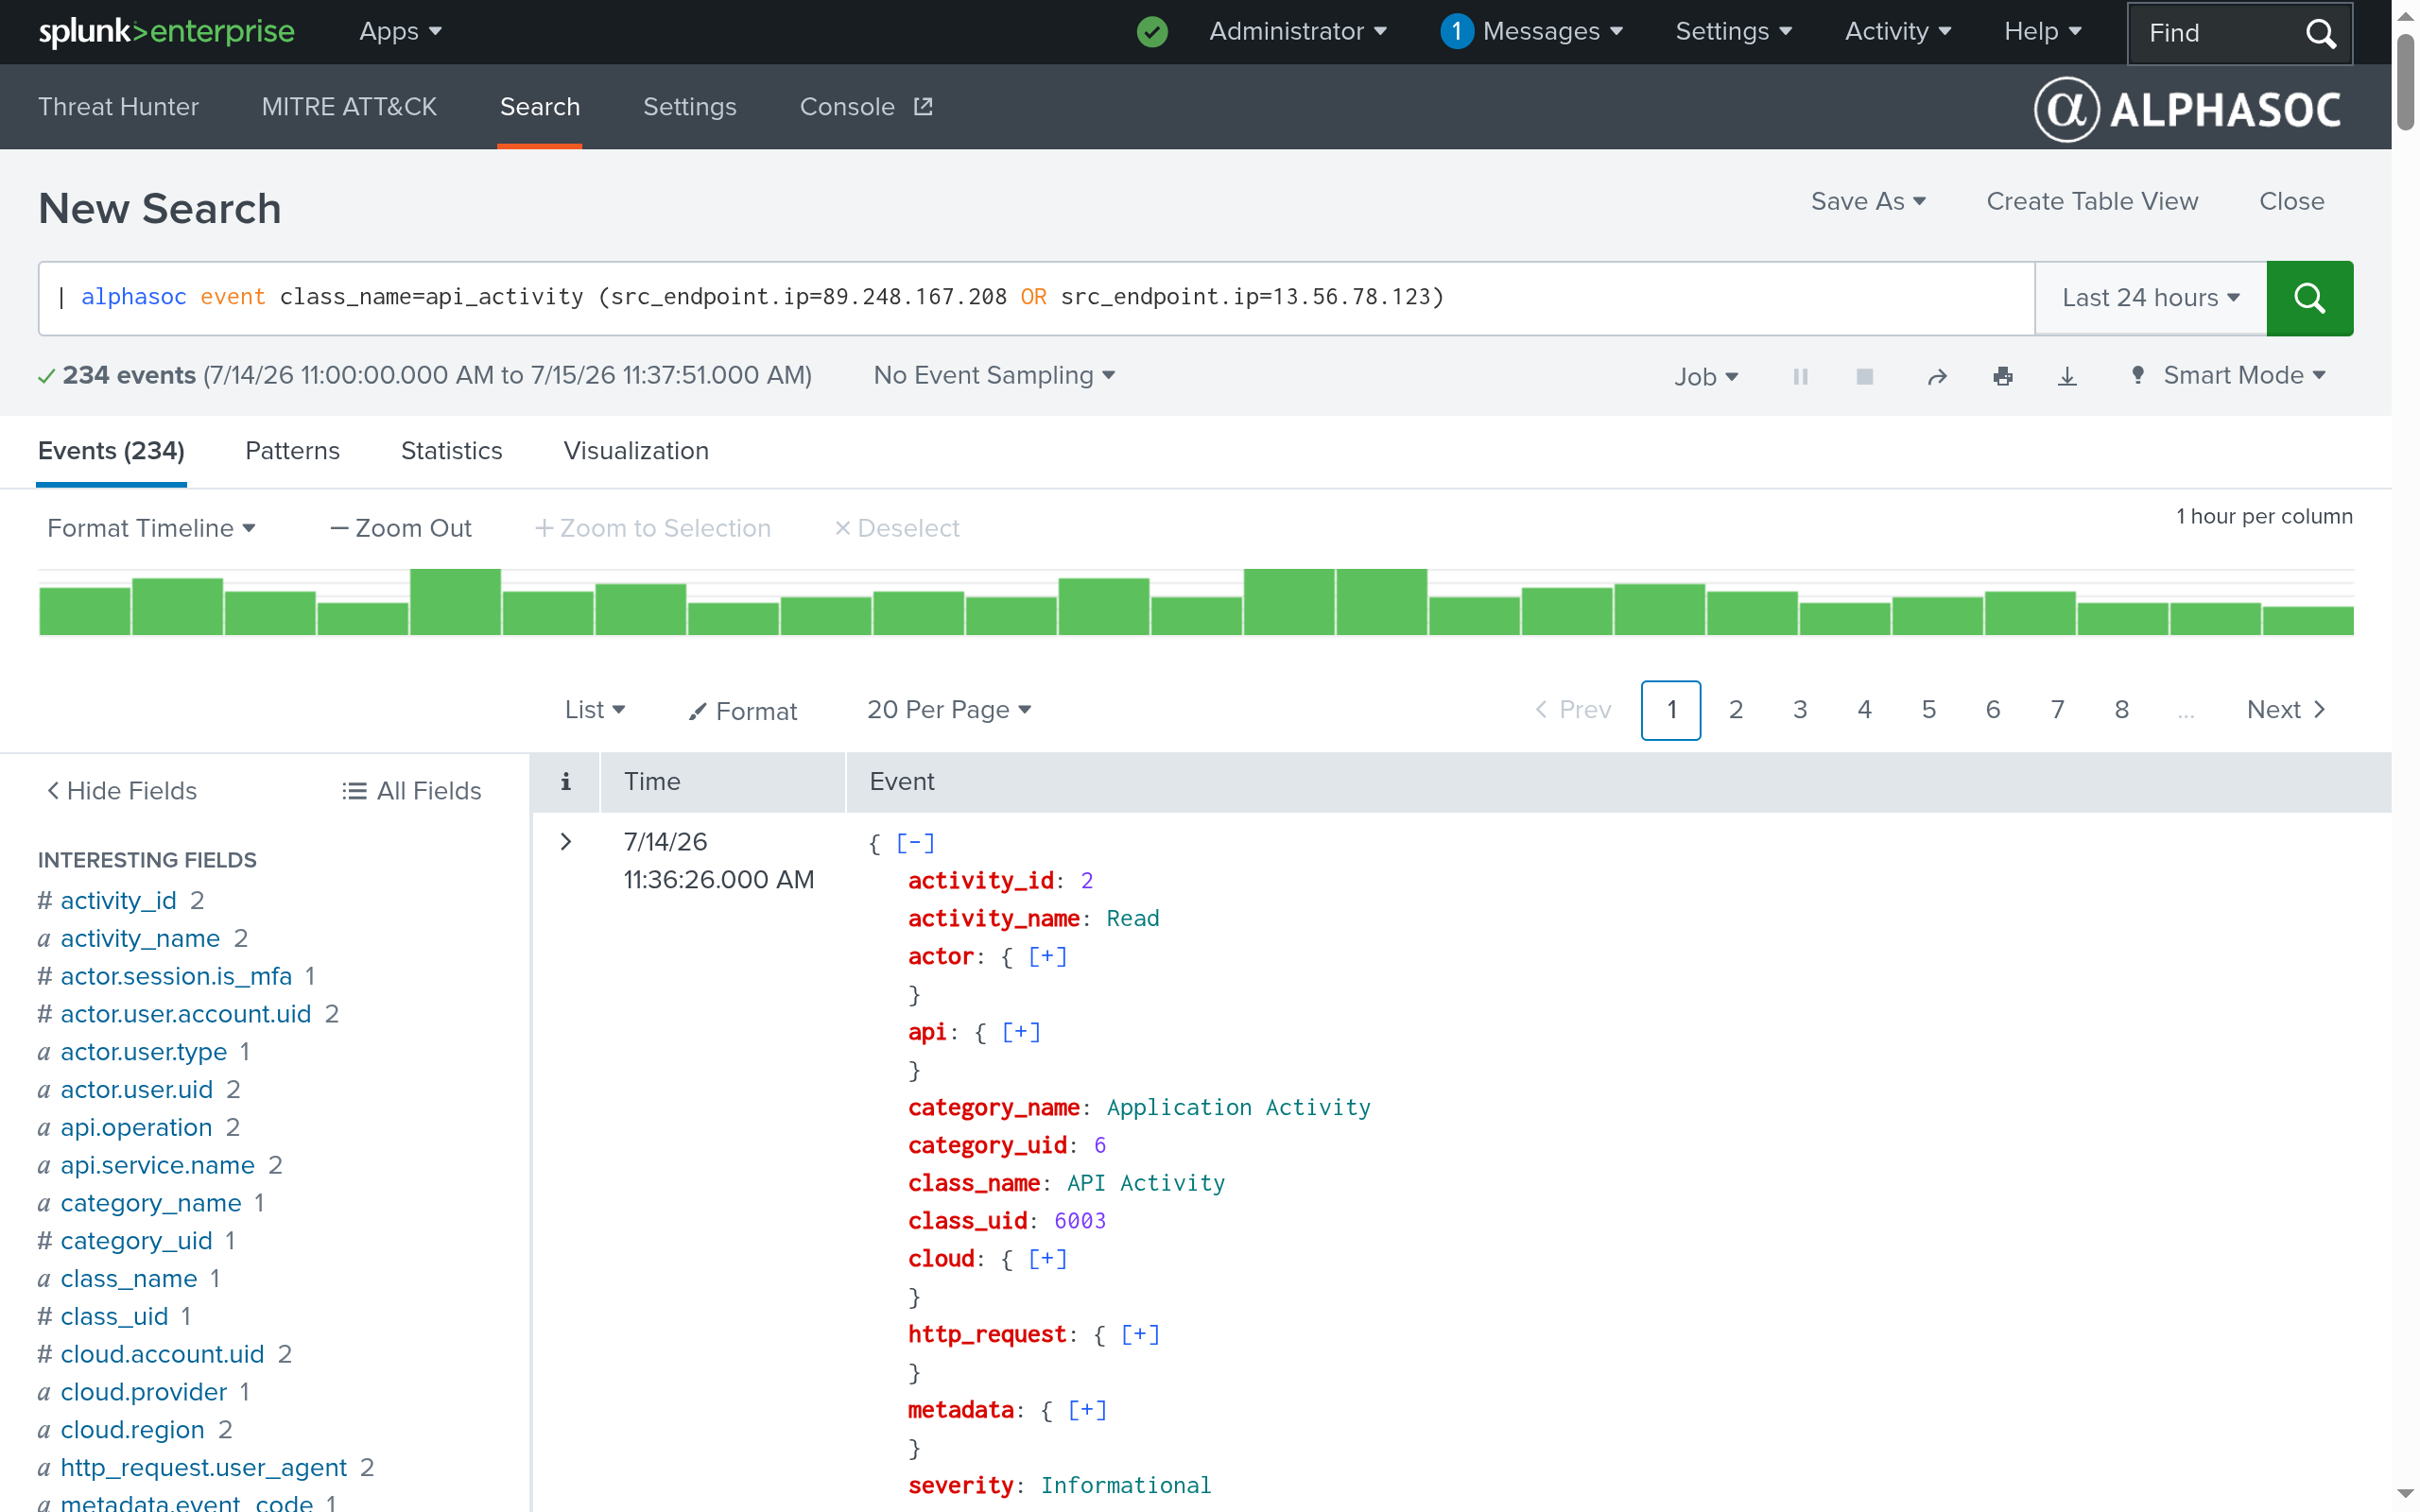
| alphasoc event [class_name=<class>] [metadata.product.name=<source>] [<filter_expression>]
| alphasoc evidence [evidence_type=<type>] <filter_expression>
| alphasoc activity [evidence_type=<type>] [metadata.product.name=<source>] <filter_expression>
| alphasoc stats [dataOrigin=<origin>]
| alphasoc help
alphasoc has five subcommands (the subcommand name is case-insensitive):
event— query raw OCSF event telemetry.evidence— query the threat evidences AlphaSOC flagged.activity— query threat evidences joined with the source identity that produced them.stats— check hourly event volume and source coverage, optionally for specific data origins.help— open this documentation in your browser.
Query syntax
The filter grammar and value rules below apply to the event, evidence, and
activity subcommands.
Filters are field-value pairs on OCSF field paths; combine them with AND /
OR operators and parentheses.
ANDis implicit: adjacent filters without an operator combine withAND. For example,device.ip=10.0.0.5 dst_endpoint.port=443is equivalent todevice.ip=10.0.0.5 AND dst_endpoint.port=443.ANDhas higher precedence thanOR. Use parentheses to make grouping explicit when mixing both.- Quote values containing anything other than ASCII letters, digits, and
. * _ : / -, such as spaces,=, or@.
Fields containing []
Splunk reads an unquoted [ as the start of a subsearch and consumes the array
accessor before the alphasoc command receives it. Quote the field path:
| alphasoc evidence "process.file.hashes[].value"=399eaf1c3f33a29e69785b7ec432ae778f13884abd6a513d87892d49e1062cd3
| alphasoc event "tls.certificate.fingerprints[0].value"=d3b07384d113edec49eaa6238ad5ff00
Options
Each subcommand supports its own set of options, described in its section below. Options can appear before or after filter terms.
To match more than one value, repeat the option and join the terms with OR,
for example class_name=dns_activity OR class_name=network_activity. OR may
only join values of the same option; the command rejects an option OR-ed with
a filter field, such as class_name=dns_activity OR device.ip=10.0.0.5.
When combining an OR group with further filter terms, parenthesize the group:
write (class_name=dns_activity OR class_name=network_activity) device.ip=10.0.0.5, not class_name=dns_activity OR class_name=network_activity device.ip=10.0.0.5.
Streaming and limits
The event, evidence, and activity commands stream results: events appear
in Splunk as they arrive from the data lake. A server-side limit may cap a large
result set, in which case you receive a partial result set. To reduce the
result set, use a shorter time range or more specific filters.
stats
Returns statistics for events processed by AlphaSOC, per hour by default or over longer intervals such as days. Use it to check ingestion volume and which credentials, data origins, and data types contributed events in the selected time range. It reads processing statistics rather than individual records from the data lake.
| alphasoc stats [intervalHours=<hours>] [dataOrigin=<origin>]
Without a filter, stats covers every data origin. To check specific sources,
add dataOrigin=, and join several with OR:
| alphasoc stats dataOrigin=aws-cloudtrail
| alphasoc stats dataOrigin=aws-cloudtrail OR dataOrigin=zeek-dns
Filtering by data origin
- Use the names shown in the
dataOriginfield of the results, which are also listed in the data origins documentation, for exampleaws-cloudtrailorokta-audit. Names must match exactly, including case and hyphens:aws_cloudtrailandAWS-CloudTrailare rejected. If you are not sure what a source is called, run| alphasoc statswithout a filter and check thedataOriginvalues. metadata.product.name=works the same way asdataOrigin=, so you can reuse the data origin filter from youreventsearches.- Apart from
intervalHours,dataOriginis the only fieldstatsaccepts. Other fields, such asclass_name, return an error, and so does joining two data origins withAND, because each event comes from a single data origin. dataOrigin=unknownreturns only events whose data origin was recorded asunknown. Events received without any data origin appear only when no filter is used.
Summarizing over longer intervals
By default, each result covers one hour. To summarize longer periods, such as
days, add intervalHours=. When combining it with several data origins,
parenthesize the OR group:
| alphasoc stats intervalHours=24
| alphasoc stats intervalHours=24 (dataOrigin=aws-cloudtrail OR dataOrigin=zeek-dns)
| alphasoc stats intervalHours=0
- Intervals are counted from the start of the selected time range, rounded down
to the hour. If the range does not divide evenly, the most recent interval is
shorter, and its
intervalHoursfield shows how many hours it covers. For example, a 7-day range ending at 10:20 covers 169 hours, from 10:00 seven days earlier to 11:00, sointervalHours=24returns seven 24-hour intervals and a final 1-hour interval. intervalHours=0returns a single interval covering the whole time range.- The value must be a whole number of hours and cannot be longer than the
selected time range.
intervalHours=1is the same as leaving it out. UsingintervalHours=twice returns an error. - The data scope and endpoint counts are approximate distinct counts for the
whole interval. AlphaSOC merges the hourly estimates before counting, so a
scope or endpoint seen in several hours is counted once. Use
intervalHours, rather than adding hourly results, to count unique scopes or endpoints over a day or the whole range.
Results
Each result represents one credential, interval, data origin, and data type.
timeBucket is the start of the interval in UTC, and intervalHours is the
number of hours it covers: 1 unless you set intervalHours. time is the
same instant as timeBucket in Unix epoch milliseconds for Splunk time-series
commands. The counts are grouped under stats:
| Field | Meaning |
|---|---|
stats.events | Exact count of events processed in that row. |
stats.dataScopes | Approximate number of distinct data scopes in that row. |
stats.endpoints | Approximate number of distinct endpoints in that row. |
For example, | alphasoc stats returns a result like this in Splunk Search:
{
  "time": 1785578400000,
  "credentialID": "11111111-1111-4111-8111-111111111111",
  "timeBucket": "2026-08-01T10:00:00Z",
  "intervalHours": 1,
  "dataOrigin": "aws-cloudtrail",
  "dataType": "audit",
  "stats": {
    "events": 4200,
    "dataScopes": 3,
    "endpoints": 12
  }
}
The data scope and endpoint counts are estimates for each row. The same scope
or endpoint may appear in multiple rows, so adding those counts does not give
the number of unique scopes or endpoints across a source or time range. To
count them over a longer period, use intervalHours instead.
The selected time range includes every hourly bucket it intersects. A range
from 10:20 to 11:10 therefore returns the complete 10:00 and 11:00 buckets,
which may include events outside the exact bounds. The current hour can still
be incomplete. If no time bounds are supplied, the command uses the last seven
days. One request can cover at most 31 days; select a shorter range if needed.
The stats response is not truncated by the data lake's response-size limit.
event
Returns ingested event telemetry, normalized to OCSF.
| alphasoc event [class_name=<class>] [metadata.product.name=<source>] [<filter_expression>]
With no filter, event returns all events in the selected time range.
Options
class_name— OCSF event classes. Accepts Title Case, snake_case, and dash-separated formats. Examples:"DNS Activity","dns_activity","dns-activity".metadata.product.name— data origins. See AlphaSOC data origins documentation for the complete list.
Supported OCSF classes: DNS Activity, Network Activity, HTTP Activity, API
Activity, Process Activity, Authentication, Account Change, File System
Activity, Kernel Extension Activity, Module Activity, Scheduled Job Activity,
Script Activity, Base Event. Events without a class-specific mapping export as
Base Event (class_uid 0) with the original event attached under raw_data;
select them with class_name=base_event.
Queryable fields
Field paths follow OCSF v1.5.0.
| OCSF Field | Description | Example |
|---|---|---|
device.ip | Device IP address (IPv4; supports /16, /24, /32 CIDR) | 10.0.0.0/24 |
device.hostname | Device hostname | workstation-01 |
device.uid | Device identifier (e.g., CrowdStrike AID) | 09e8771fc488477d9cddb61b5fd32c6c |
device.mac | Device MAC address | 00:1A:2B:3C:4D:5E |
actor.user.name | User name | alice |
metadata.tenant_uid | Tenant UID that matches AlphaSOC's dataScope | aws:123456789012:us-east-1:vpc-1234567890 |
query.hostname | DNS query fully qualified domain name (FQDN); supports a leading wildcard | *.google.com |
query.type | DNS query type | A |
src_endpoint.ip | Source IP address of API Activity, Authentication, and Account Change events (IPv4; supports /16, /24, /32 CIDR) | 192.0.2.10 |
dst_endpoint.ip | Destination IP address (IPv4; supports /16, /24, /32 CIDR) | 8.8.8.8 |
dst_endpoint.port | Destination port | 443 |
connection_info.protocol_name | IP protocol | tcp |
http_request.http_method | HTTP client request method | GET |
http_request.url.hostname | Hostname of the HTTP request URL; supports a leading wildcard | *.example.org |
http_request.url.path | Path of the HTTP request URL | /beacon |
http_request.url.scheme | Scheme of the HTTP request URL | https |
http_request.url.url_string | Full URL | https://example.org/path |
http_request.user_agent | HTTP client user agent | "Mozilla/5.0 (X11; Linux x86_64)" |
tls.certificate.fingerprints[0].value | TLS server certificate fingerprint | 0db6495611891de35650a18ad91002845f9cc6bc |
tls.certificate.subject | TLS server certificate subject | "CN=example.org" |
tls.certificate.issuer | TLS server certificate issuer | "CN=GTS CA,O=Google Trust Services,C=US" |
tls.ja3_hash.value | JA3 TLS fingerprint | 0b2a5b08a7c44adaeaa1c0d29493c409 |
tls.ja3s_hash.value | JA3S TLS fingerprint | 254c31292ed05b84addc077fe6cee283 |
process.file.name | Process file name | powershell.exe |
process.file.hashes[].value | Process file hash (MD5 or SHA-256) | d41d8cd98f00b204e9800998ecf8427e |
Examples
Fetch all events in the selected time range:
| alphasoc event
Filter events by device IP:
| alphasoc event device.ip=10.0.0.5
Combine filters with implicit AND (both forms are equivalent):
| alphasoc event device.ip=10.0.0.5 dst_endpoint.port=443
Filter by event class and device:
| alphasoc event class_name=dns_activity device.ip=10.0.0.5
Match multiple event classes by repeating the option with OR:
| alphasoc event class_name=dns_activity OR class_name=network_activity
Parenthesize the OR group when combining it with other filters:
| alphasoc event (class_name=dns_activity OR class_name=network_activity) device.ip=10.0.0.5
Combine options and filters with boolean logic:
| alphasoc event class_name=dns_activity device.ip=10.0.0.5 AND (query.hostname=example.org OR dst_endpoint.port=443)
Filter HTTP events by the hostname of the requested URL:
| alphasoc event class_name=http_activity http_request.url.hostname=*.example.org
Query a specific data origin:
| alphasoc event metadata.product.name=aws-route53 query.hostname=example.org
evidence
Returns the individual indicators AlphaSOC observed and flagged. Each evidence
record is an OCSF event carrying an evidences[] array of those indicators.
| alphasoc evidence [evidence_type=<type>] <filter_expression>
The evidence subcommand requires at least one filter; it cannot run
unfiltered.
Options
evidence_type— restricts which evidence types are searched. Accepted values:dns,ip,http,tls,audit,system. This changes results: an unfiltered value such as a hostname can match both DNS and HTTP evidences.
Queryable fields
Field paths follow OCSF v1.5.0.
| OCSF Field | Description | Example |
|---|---|---|
query.hostname | DNS query fully qualified domain name (FQDN); supports a leading wildcard | *.google.com |
query.type | DNS query type | A |
src_endpoint.ip | Source IP address of audit evidences (IPv4; supports /16, /24, /32 CIDR) | 192.0.2.10 |
dst_endpoint.ip | Destination IP address (IPv4; supports /16, /24, /32 CIDR) | 8.8.8.8 |
dst_endpoint.port | Destination port | 443 |
connection_info.protocol_name | IP protocol | tcp |
http_request.http_method | HTTP client request method | GET |
http_request.url.hostname | Hostname of the HTTP evidence URL; supports a leading wildcard | *.example.org |
http_request.url.path | Path of the HTTP evidence URL | /beacon |
http_request.url.scheme | Scheme of the HTTP evidence URL | https |
http_request.url.url_string | Full URL | https://example.org/path |
http_request.user_agent | HTTP client user agent | "Mozilla/5.0 (X11; Linux x86_64)" |
tls.certificate.fingerprints[0].value | TLS server certificate fingerprint | 0db6495611891de35650a18ad91002845f9cc6bc |
tls.certificate.subject | TLS server certificate subject | "CN=example.org" |
tls.certificate.issuer | TLS server certificate issuer | "CN=GTS CA,O=Google Trust Services,C=US" |
tls.ja3_hash.value | JA3 TLS fingerprint | 0b2a5b08a7c44adaeaa1c0d29493c409 |
tls.ja3s_hash.value | JA3S TLS fingerprint | 254c31292ed05b84addc077fe6cee283 |
process.file.name | Process file name | powershell.exe |
process.file.hashes[].value | Process file hash (MD5 or SHA-256) | d41d8cd98f00b204e9800998ecf8427e |
The http_request.url.* fields match single components of an HTTP evidence URL.
Path and scheme matching ignores case. http_request.url.path matches the path
only, so the command rejects a value carrying a query string or fragment.
dst_endpoint.port matches the URL's effective port: the scheme default when
the URL carries no explicit port, so https://example.org/path matches
dst_endpoint.port=443.
Use http_request.url.url_string to match a whole URL in one term. The value
must be a full, parseable URL. It matches the scheme, host, path, and effective
port together, ignoring query strings and fragments.
Examples
Query threat evidences for a hostname:
| alphasoc evidence query.hostname=example.org
Combine filters with implicit AND:
| alphasoc evidence dst_endpoint.ip=8.8.8.8 dst_endpoint.port=443
Restrict the search to DNS evidences:
| alphasoc evidence evidence_type=dns query.hostname=example.org
Filter by JA3 fingerprint:
| alphasoc evidence tls.ja3_hash.value=0b2a5b08a7c44adaeaa1c0d29493c409
Filter by URL host and path:
| alphasoc evidence http_request.url.hostname=example.org http_request.url.path=/beacon
Match a full URL in one term:
| alphasoc evidence http_request.url.url_string=https://example.org/beacon
Filter by process file hash, quoting the bracketed field path (see Query syntax):
| alphasoc evidence "process.file.hashes[].value"=d41d8cd98f00b204e9800998ecf8427e
activity
Returns threat evidences joined with the source identity observed for the same
query: which device resolved example.org, and as which user. Each record shares
the evidences[] shape of the evidence subcommand, with the source reported
under evidences[].device and evidences[].actor.user.
| alphasoc activity [evidence_type=<type>] [metadata.product.name=<source>] <filter_expression>
The activity subcommand requires at least one filter; it cannot run
unfiltered.
The search still returns records without an observed source (their device and
actor are empty). Filtering on a source field (device.*, actor.user.name,
metadata.tenant_uid, or the metadata.product.name option) restricts results
to records with a source.
Options
evidence_type— same as theevidencesubcommand. Accepted values:dns,ip,http,tls,audit,system.metadata.product.name— restricts to sources observed by the given data origins. See AlphaSOC data origins documentation for the complete list.
Queryable fields
Activity searches accept all queryable fields and the evidence_type option
of the evidence subcommand, with the same matching behavior. For example,
process.file.name=powershell.exe returns matching file executions together
with the device and user that ran them. src_endpoint.ip remains an evidence
field; use device.ip for the source device.
Source fields identify the device and user behind the evidence:
| OCSF Field | Description | Example |
|---|---|---|
device.ip | Source device IP address (IPv4; supports /16, /24, /32 CIDR) | 10.0.0.0/24 |
device.hostname | Source device hostname | workstation-01 |
device.uid | Source device identifier (e.g., CrowdStrike AID) | 09e8771fc488477d9cddb61b5fd32c6c |
device.mac | Source device MAC address | 00:1A:2B:3C:4D:5E |
actor.user.name | User name | alice |
metadata.tenant_uid | Tenant UID that matches AlphaSOC's dataScope | aws:123456789012:us-east-1:vpc-1234567890 |
Source fields and evidence fields combine with AND only; the command rejects
an OR across the two groups, such as device.ip=10.0.0.5 OR query.hostname=example.org.
Examples
Find who resolved a hostname:
| alphasoc activity query.hostname=example.org
Restrict the search to a subnet:
| alphasoc activity device.ip=10.0.0.0/24 query.hostname=example.org
Find devices and users that requested a URL:
| alphasoc activity http_request.url.hostname=example.org http_request.url.path=/beacon
DNS evidences observed by a specific data origin:
| alphasoc activity evidence_type=dns metadata.product.name=aws-route53 query.hostname=example.org
Find devices and users that ran a flagged file:
| alphasoc activity evidence_type=system process.file.name=powershell.exe
help
Returns a link to this documentation without running a query:
| alphasoc help
Learn More
AlphaSOC for Splunk is free to download and install from Splunkbase, as below.