Demo Workspace
After you have signed up for AlphaSOC, you can explore the demo workspace to gain understanding of the AlphaSOC key features and capabilities. Demo workspace is pre-populated with sample data that simulates a real-world organization environment, allowing you to try out the platform without needing to connect your own data sources right away.
Getting Started with Demo Workspace
To access the demo workspace, log in to the AlphaSOC console and switch to the Demo organization from the organization selector in the top-right corner.
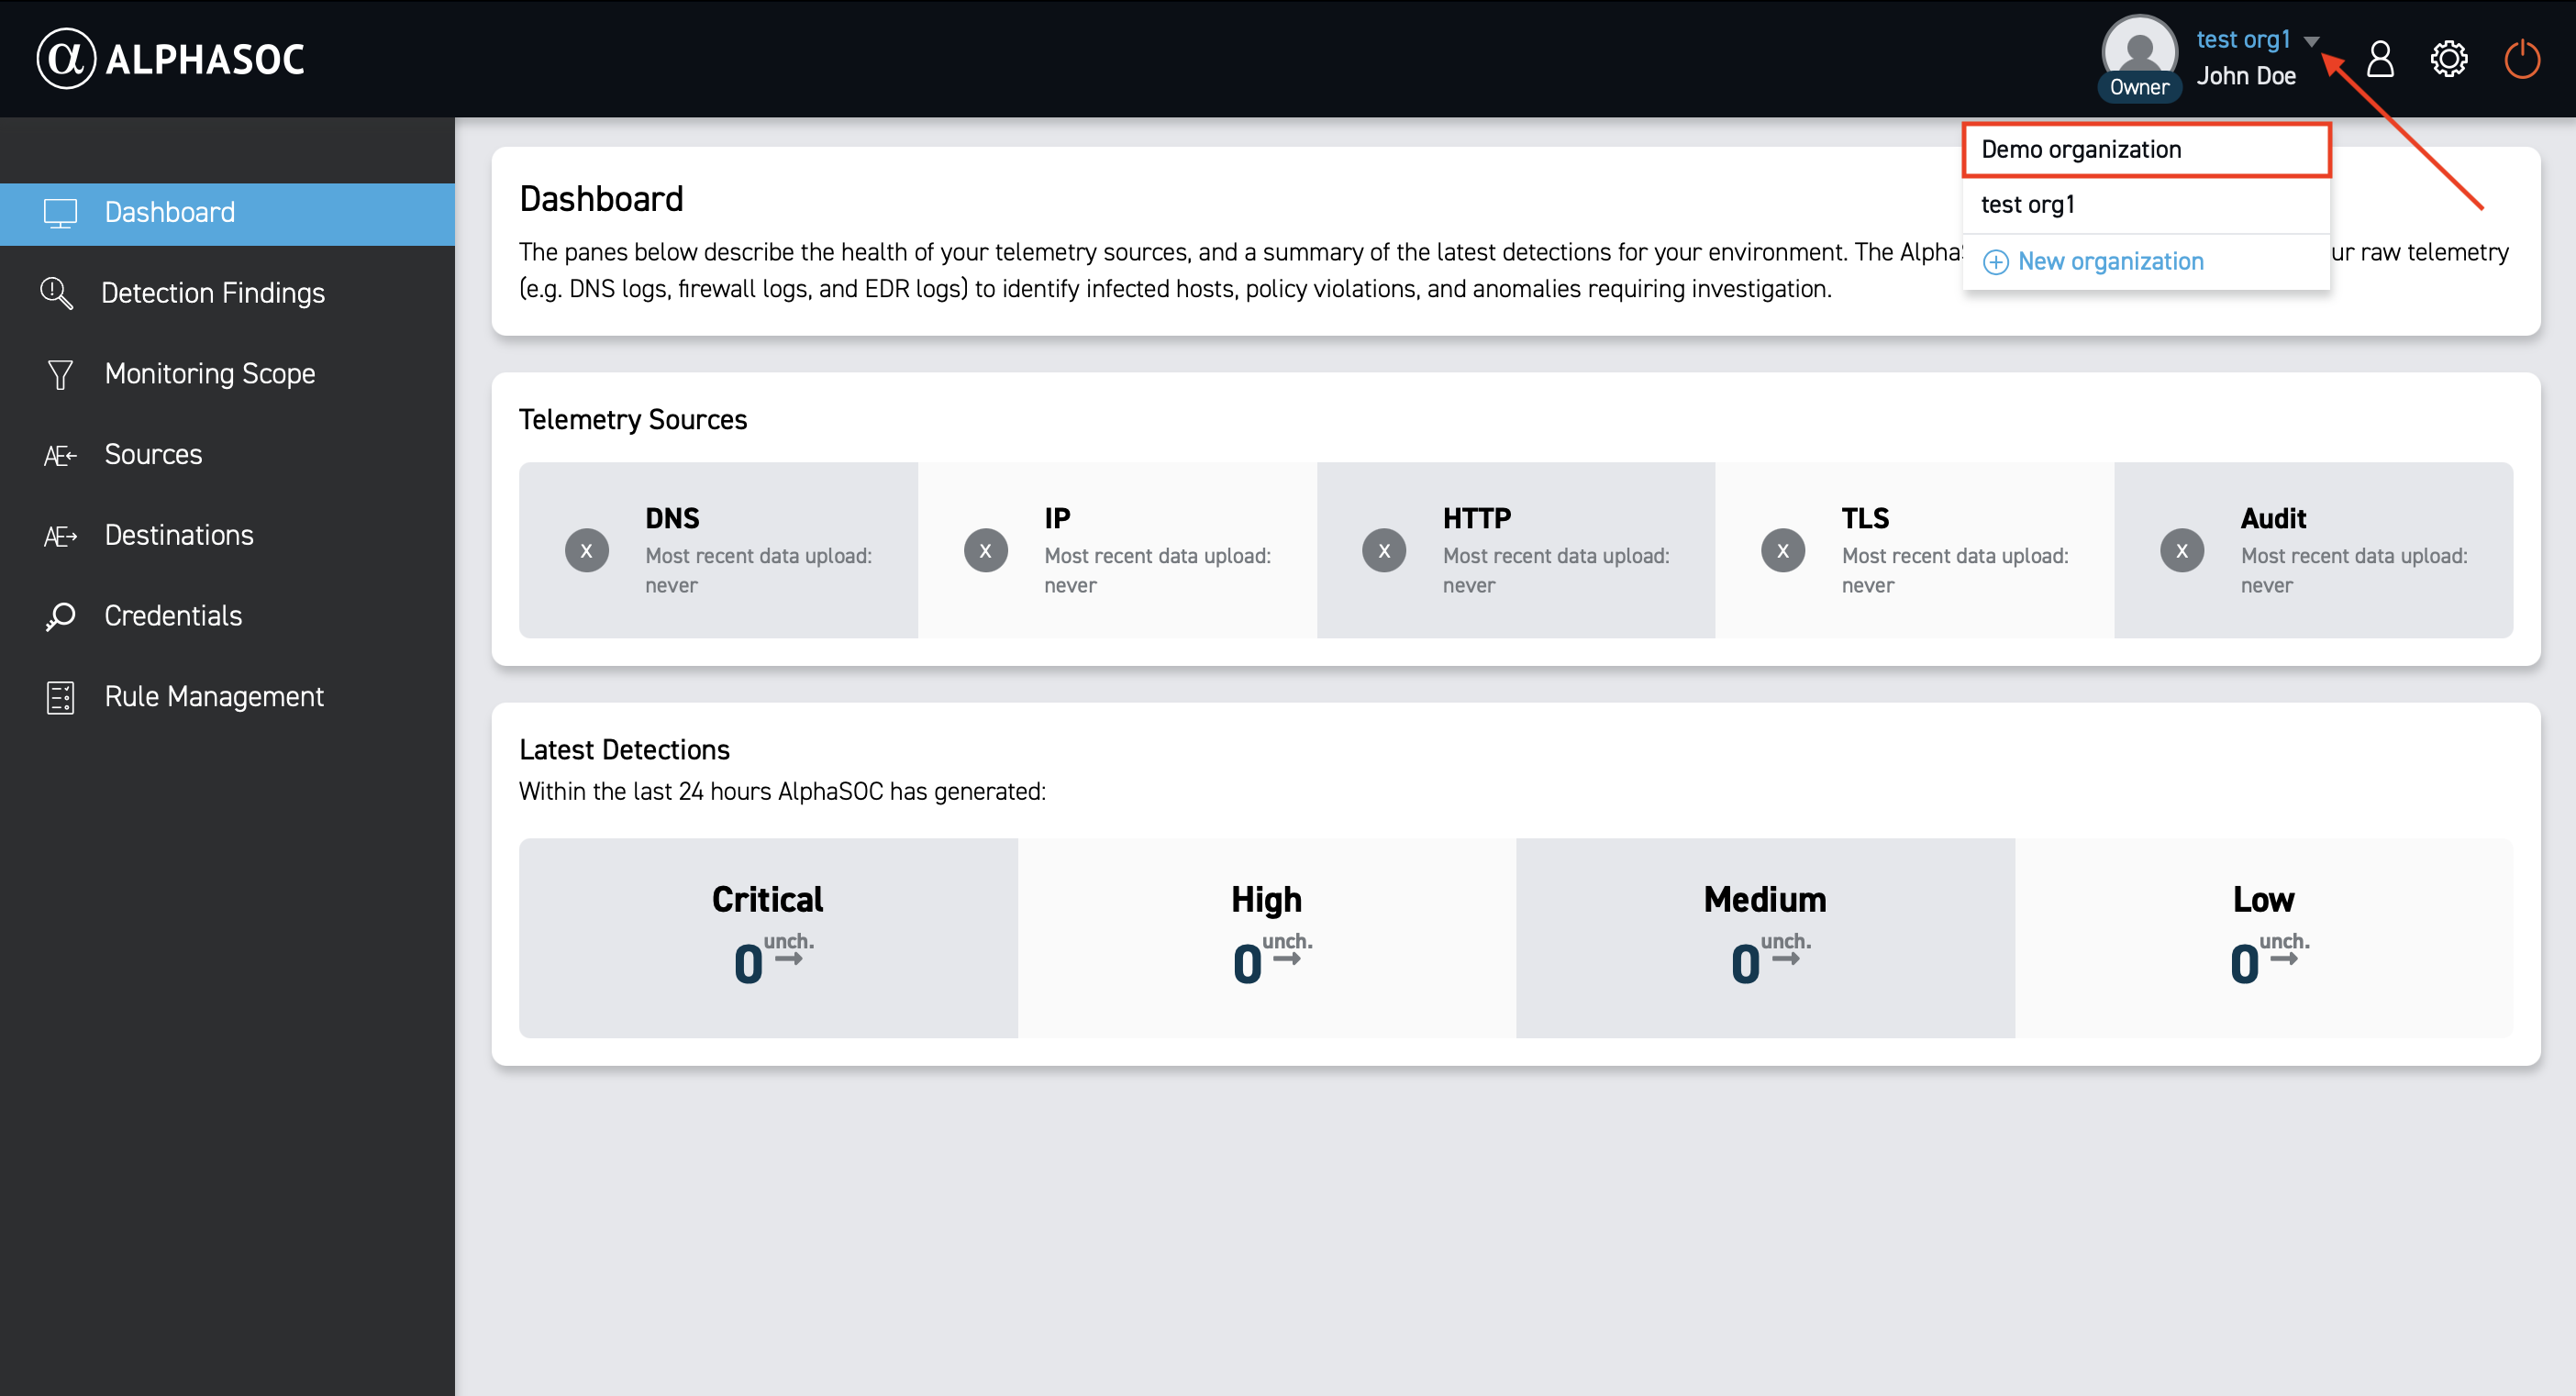
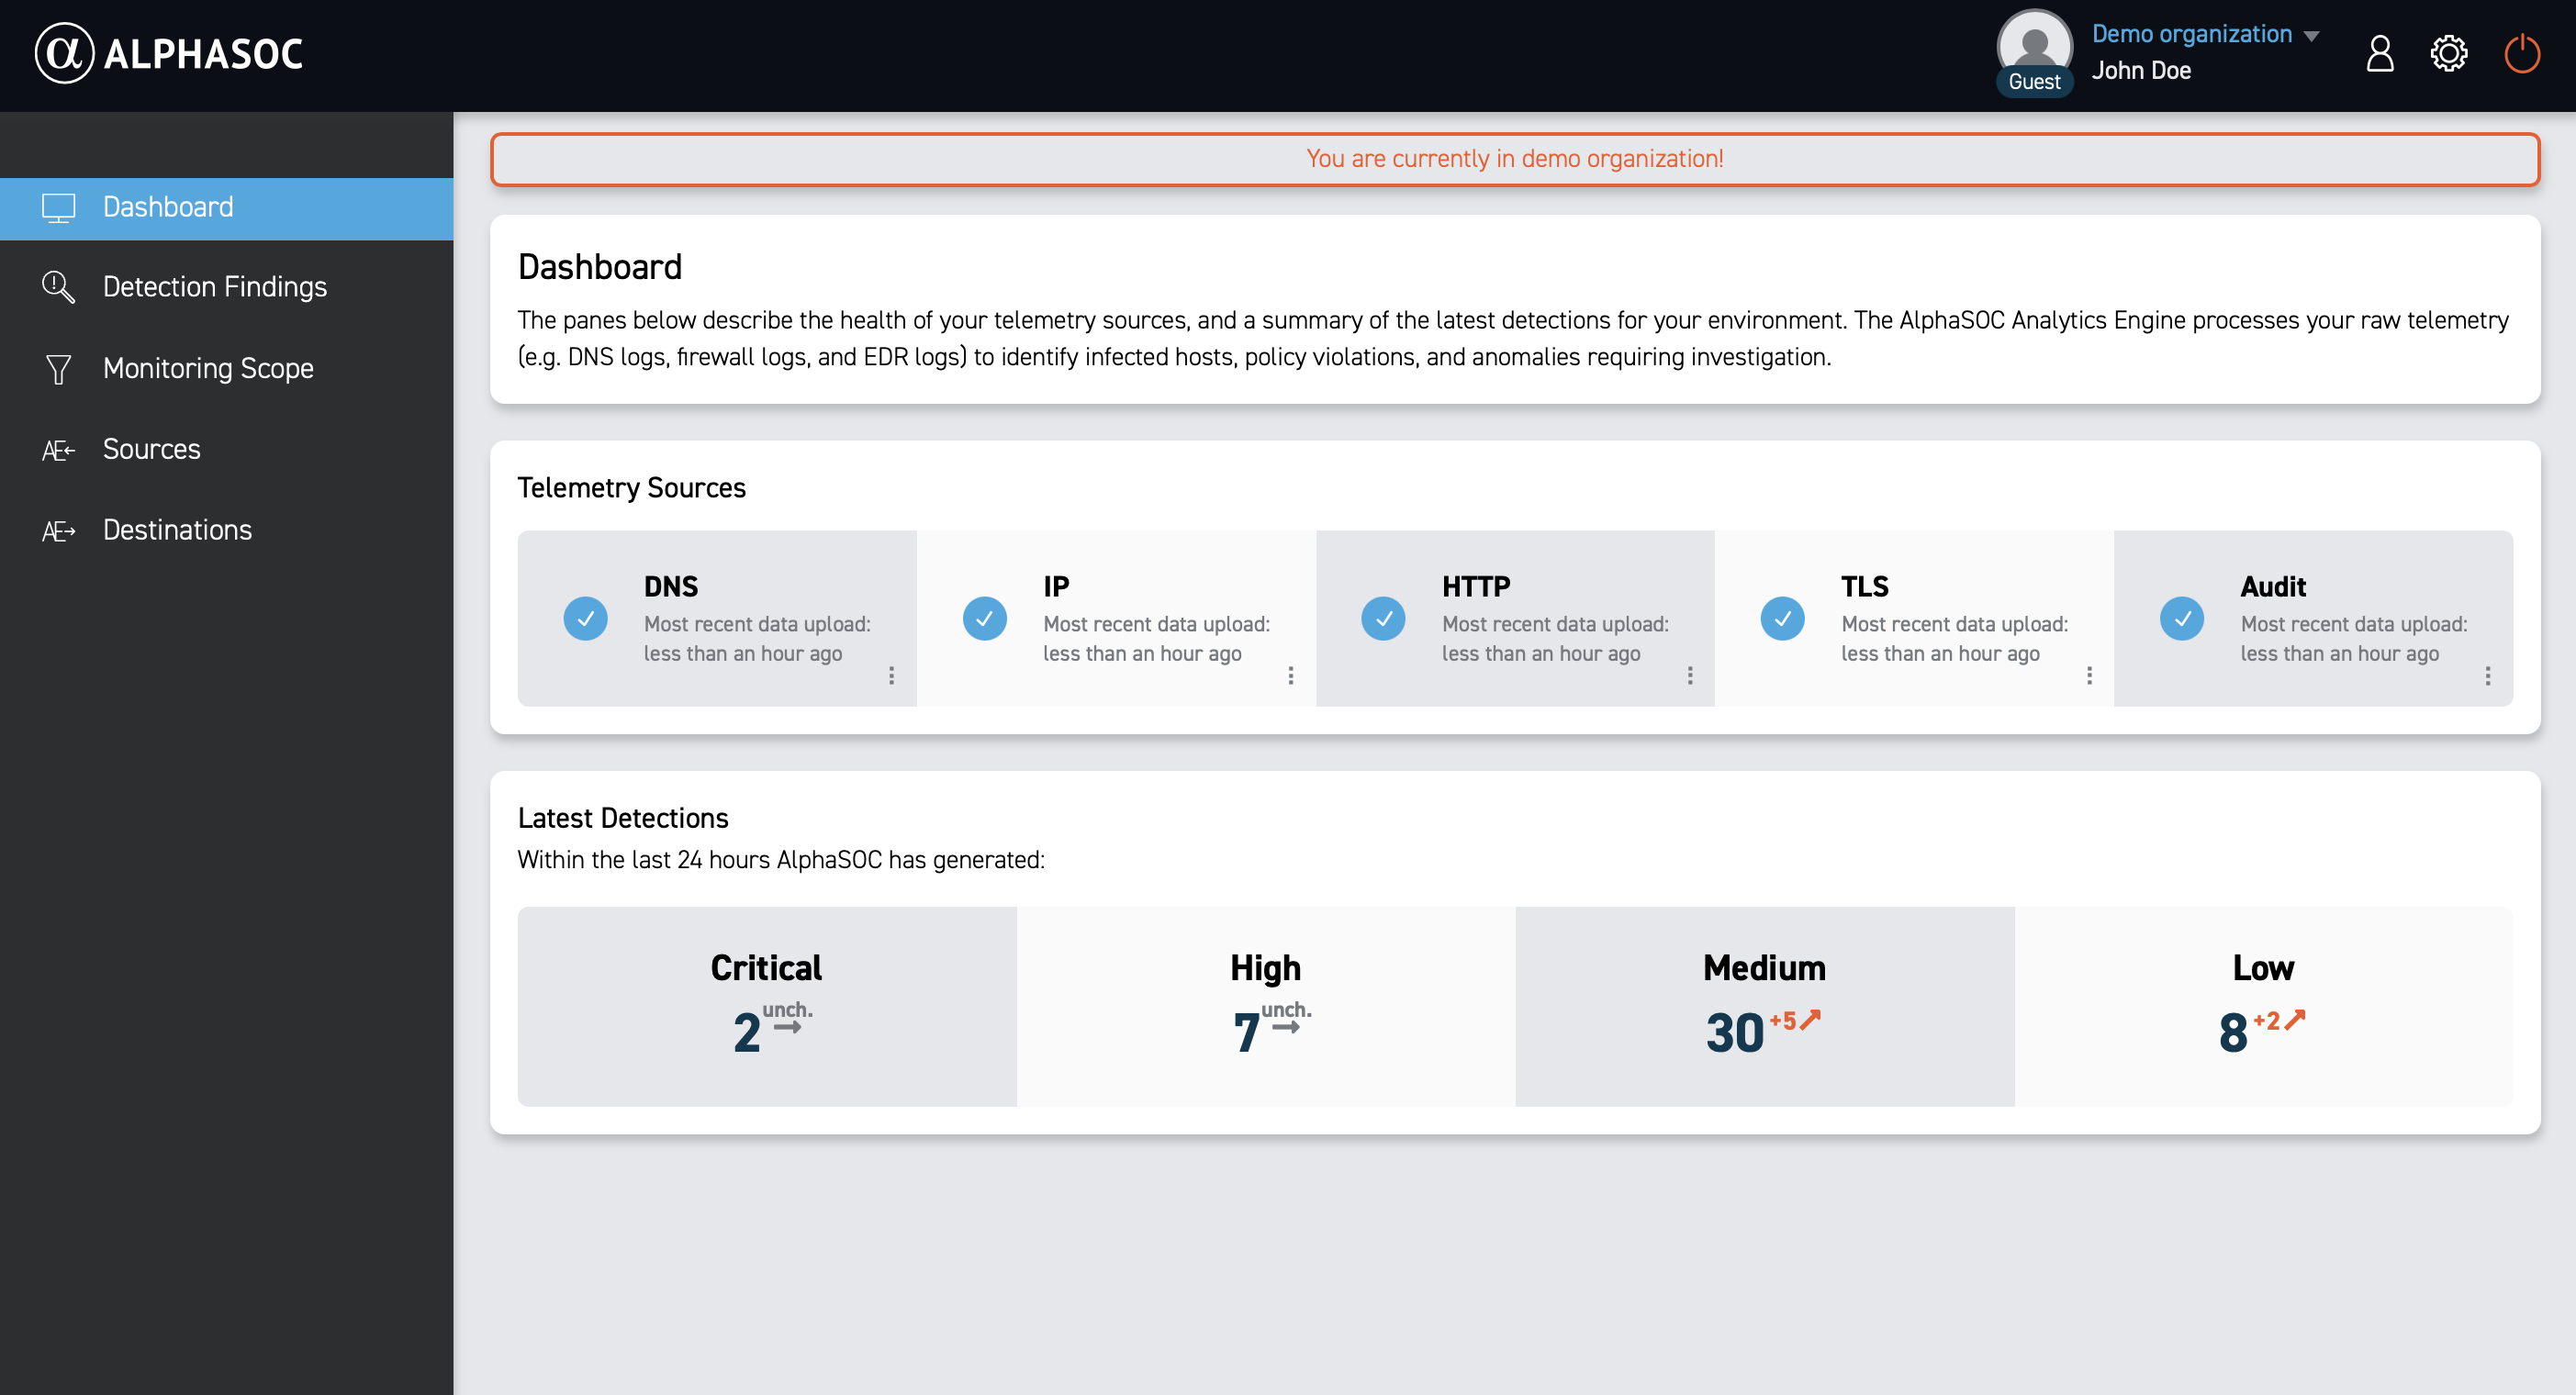
You will see a confirmation message indicating that you are now in the demo organization.
Now you're ready to dive in! The demo environment is your playground. Explore at your own pace, try out various features, and familiarize yourself with the platform. Let's start by understanding the Dashboard.
Dashboard
When you first log in to the AlphaSOC web console, you land on the Dashboard page. Use it to see a concise, last‑24‑hour view of your organization’s security posture alongside the most recent data ingested into the platform. Dashboard helps you visualize systems and applications health by severity, highlighting anomalies you can spot at a glance before diving deeper.
Telemetry Sources
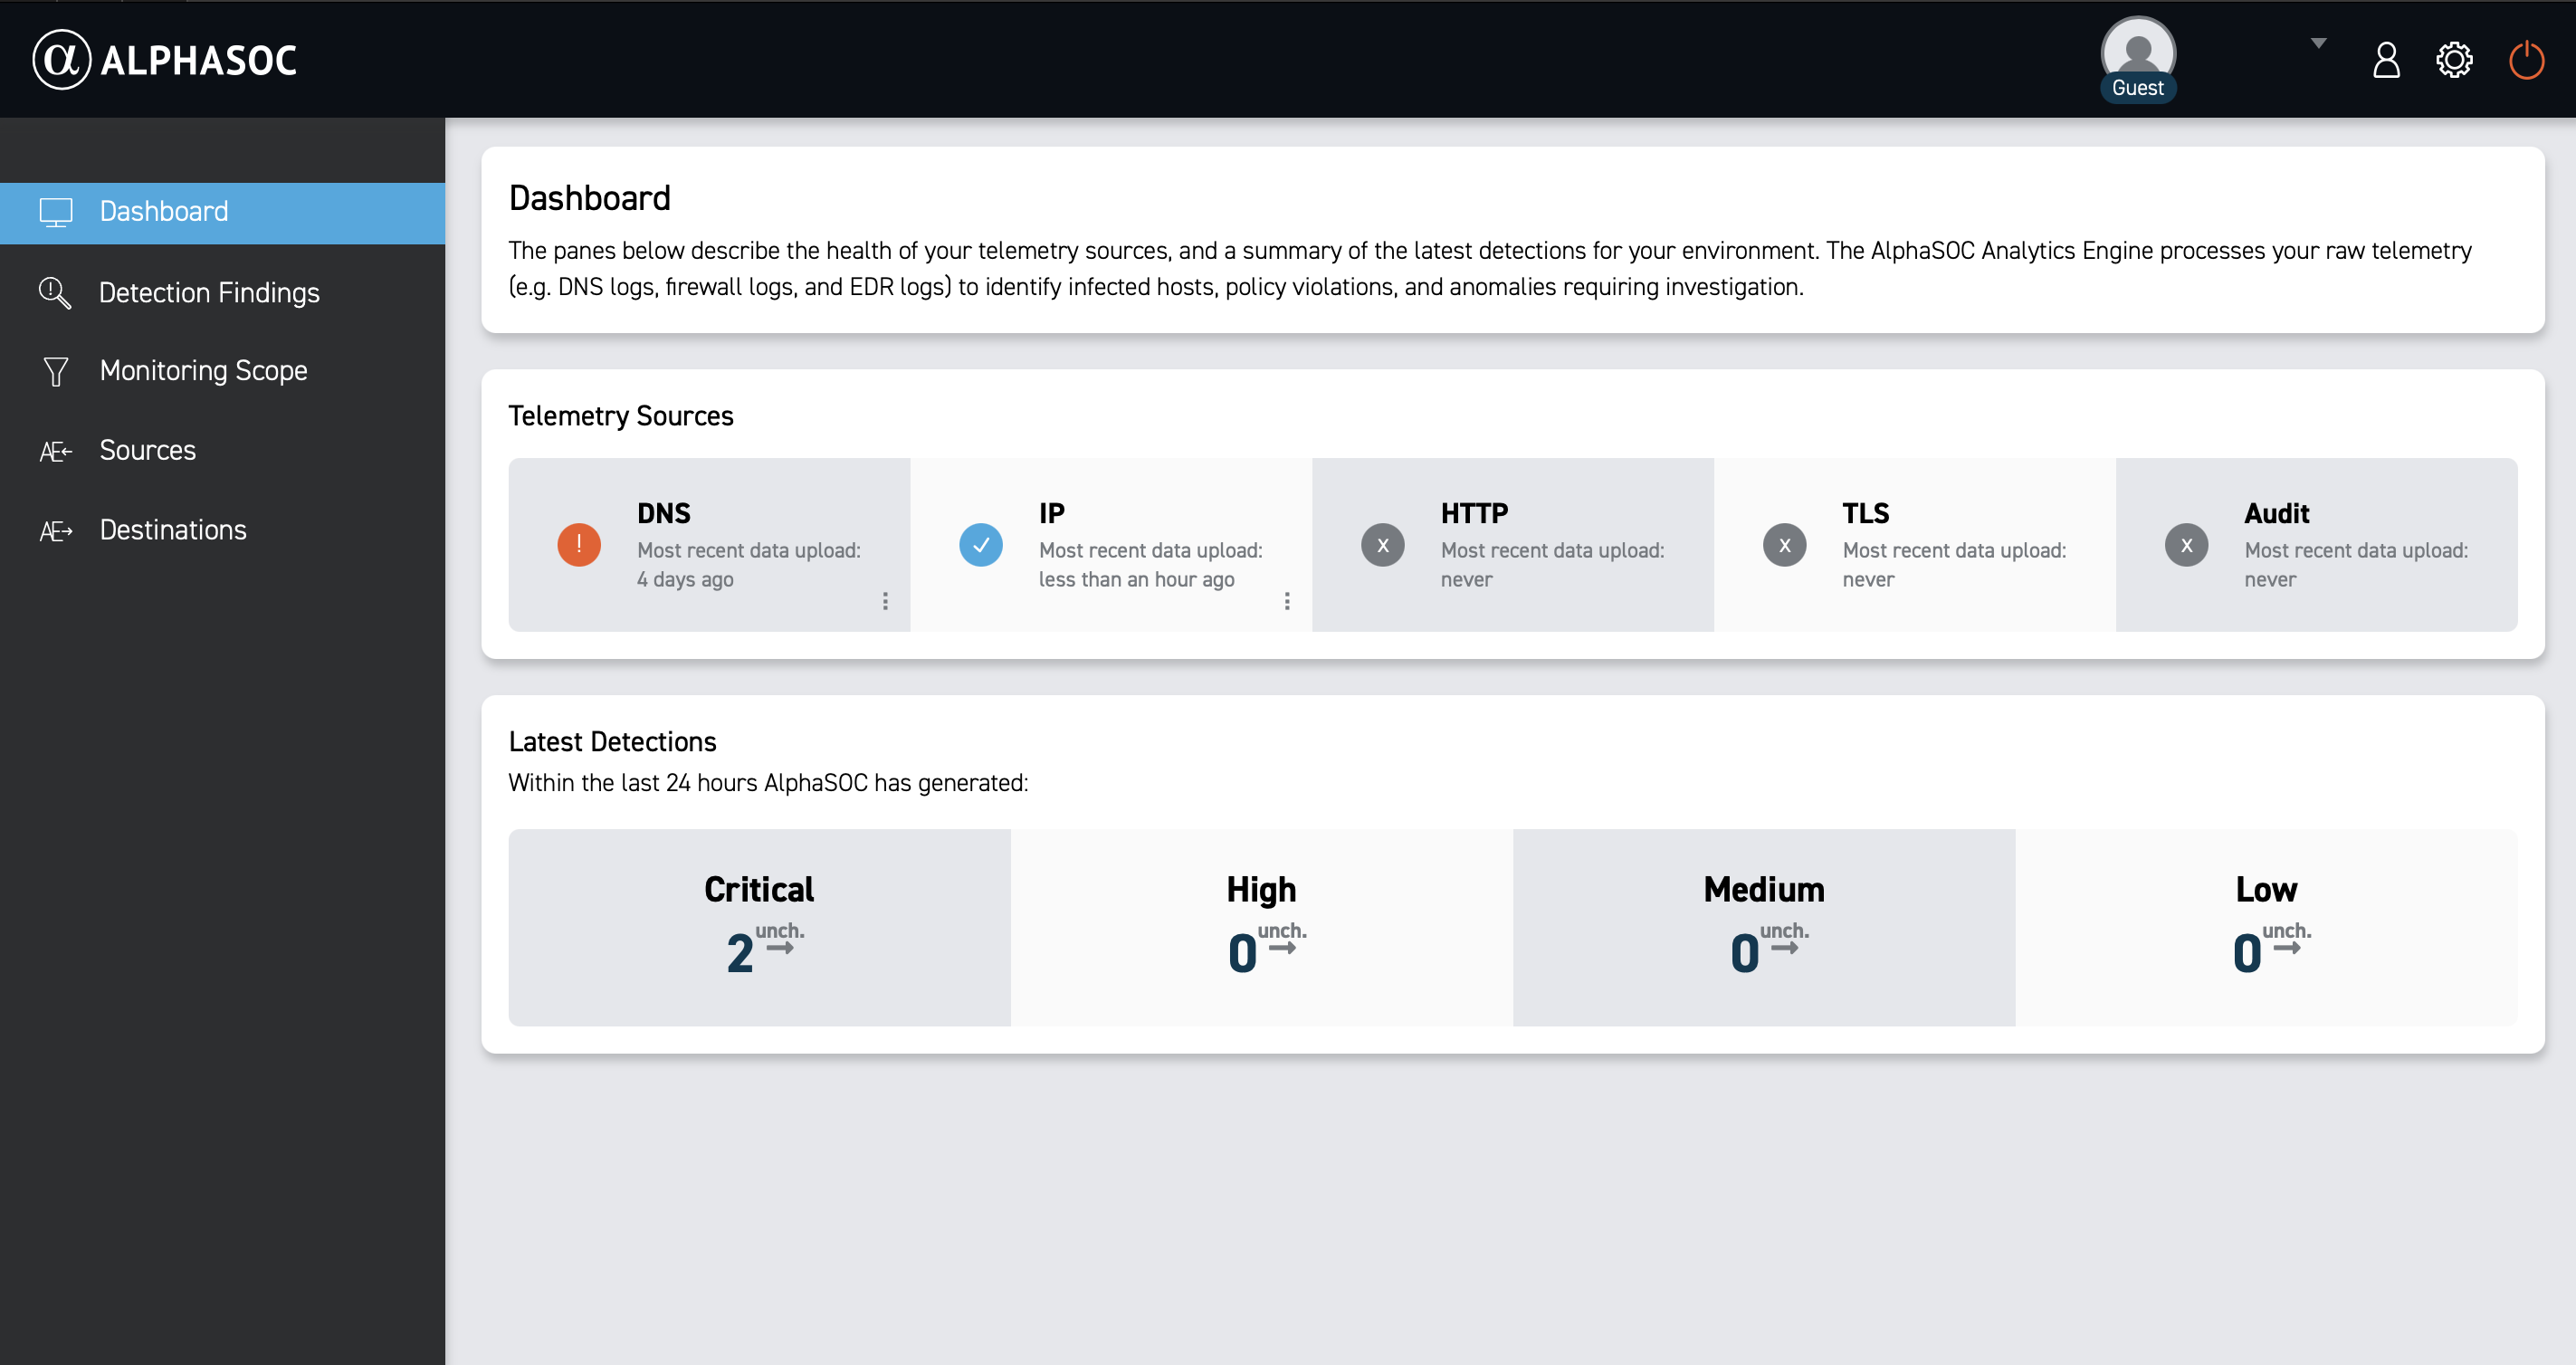
The Telemetry sources section breaks down telemetry data ingested into the platform by type (DNS, IP, HTTP, TLS, and Audit), so you can quickly verify coverage and see which feeds contribute to analysis.
To see all available telemetry sources visit the Data Normalization page.
Use this view to validate data ingestion and detect gaps in your telemetry sources. We recommend configuring your transport to update in near real time (a maximum delay of 90 minutes) to ensure you have the most current information for analysis. If the delay exceeds this threshold, the interface shows a warning icon to alert you to potential gaps in your data ingestion.
Latest Detections
The Latest Detections section summarizes detections from the past 24 hours generated by AlphaSOC, grouped by severity. It offers a quick overview of the most recent emerging threats so you can stay informed and decide where to investigate next. Counts are broken out by severity level (Critical, High, Medium, Low) and include the change in the number of detections compared with the prior day, represented by the small arrow on the right.
What's Next
Ready to explore further? Visit the Collecting Data page and learn how to set up data ingestion.